Eaglizer Pivot Boxes
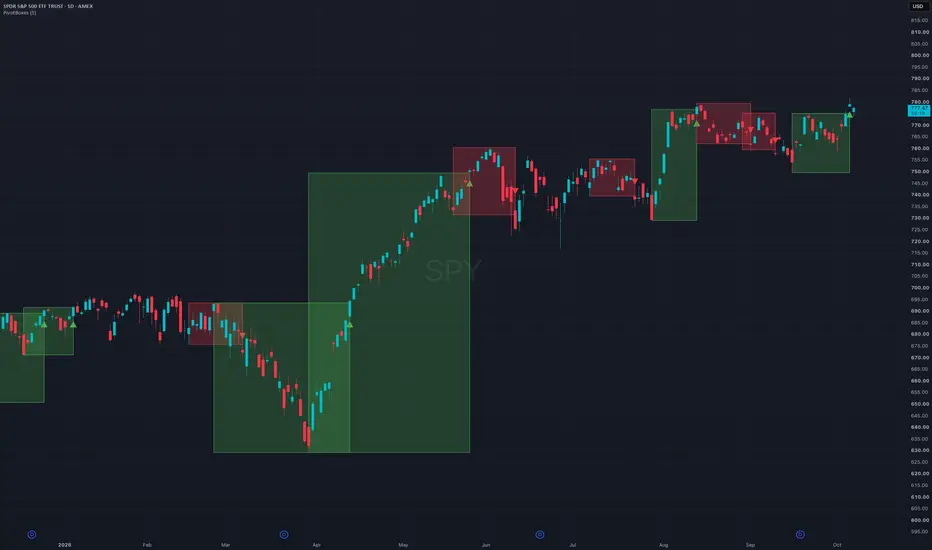
Most range tools make you drag boxes by hand and then argue with yourself about where the range really starts. This draws the box for you from the market's own swing highs and swing lows, and tells you the moment price closes out of it.
WHAT IT DOES
It confirms swing highs and swing lows using a pivot length you choose. The most recent confirmed swing high becomes the top of the box and the most recent confirmed swing low becomes the bottom. The box then extends to the right while price stays inside it.
When a bar closes above the top, the box turns green and a triangle prints under the bar. When a bar closes below the bottom, the box turns red and a triangle prints above the bar. Every time a new swing is confirmed while price is still inside, a fresh box starts.
WHY BOXES
A range is a decision the market has not made yet. Price is balancing between buyers and sellers. The close that leaves the box is the first honest sign of which side won. I would rather wait for that close than guess early.
HOW I USE IT
I use the box as a map, not a trigger. A breakout close is a reason to look at the chart, check volume, and check the trend on a higher timeframe. A breakout into a wall of resistance is a different trade from a breakout into open space.
I look at the daily and the 4 hour. On very low timeframes the swings are noise and the boxes churn.
SETTINGS
Pivot length, default 5. Higher numbers give fewer, wider boxes. Lower numbers give more, tighter ones. Boxes that ended in a breakout always stay on the chart so you can see how past ranges resolved. You can also choose to keep superseded ranges. All three colors are editable.
ALERTS
Two alert conditions are included, one for a close above the range and one for a close below. Both carry the ticker and the close price.
WHAT THIS IS NOT
This is not a complete trading system. It has no stop, no target, and no position size. It shows you the range and when it broke. Everything after that is on you.
The full system I trade adds an EMA 89, a higher timeframe EMA 34, dual RSI moving averages, a volume filter, and defined stop and target rules. If you want it, the link is on my profile.
DISCLAIMER
This is not financial advice. This indicator is a charting tool for educational purposes only. Trading involves substantial risk of loss and past behavior of any indicator does not guarantee future results. You are responsible for your own decisions.
WHAT IT DOES
It confirms swing highs and swing lows using a pivot length you choose. The most recent confirmed swing high becomes the top of the box and the most recent confirmed swing low becomes the bottom. The box then extends to the right while price stays inside it.
When a bar closes above the top, the box turns green and a triangle prints under the bar. When a bar closes below the bottom, the box turns red and a triangle prints above the bar. Every time a new swing is confirmed while price is still inside, a fresh box starts.
WHY BOXES
A range is a decision the market has not made yet. Price is balancing between buyers and sellers. The close that leaves the box is the first honest sign of which side won. I would rather wait for that close than guess early.
HOW I USE IT
I use the box as a map, not a trigger. A breakout close is a reason to look at the chart, check volume, and check the trend on a higher timeframe. A breakout into a wall of resistance is a different trade from a breakout into open space.
I look at the daily and the 4 hour. On very low timeframes the swings are noise and the boxes churn.
SETTINGS
Pivot length, default 5. Higher numbers give fewer, wider boxes. Lower numbers give more, tighter ones. Boxes that ended in a breakout always stay on the chart so you can see how past ranges resolved. You can also choose to keep superseded ranges. All three colors are editable.
ALERTS
Two alert conditions are included, one for a close above the range and one for a close below. Both carry the ticker and the close price.
WHAT THIS IS NOT
This is not a complete trading system. It has no stop, no target, and no position size. It shows you the range and when it broke. Everything after that is on you.
The full system I trade adds an EMA 89, a higher timeframe EMA 34, dual RSI moving averages, a volume filter, and defined stop and target rules. If you want it, the link is on my profile.
DISCLAIMER
This is not financial advice. This indicator is a charting tool for educational purposes only. Trading involves substantial risk of loss and past behavior of any indicator does not guarantee future results. You are responsible for your own decisions.

면책사항
해당 정보와 게시물은 금융, 투자, 트레이딩 또는 기타 유형의 조언이나 권장 사항으로 간주되지 않으며, 트레이딩뷰에서 제공하거나 보증하는 것이 아닙니다. 자세한 내용은 이용 약관을 참조하세요.
면책사항
해당 정보와 게시물은 금융, 투자, 트레이딩 또는 기타 유형의 조언이나 권장 사항으로 간주되지 않으며, 트레이딩뷰에서 제공하거나 보증하는 것이 아닙니다. 자세한 내용은 이용 약관을 참조하세요.