OPEN-SOURCE SCRIPT
Monthly DCA & Last 10 Years
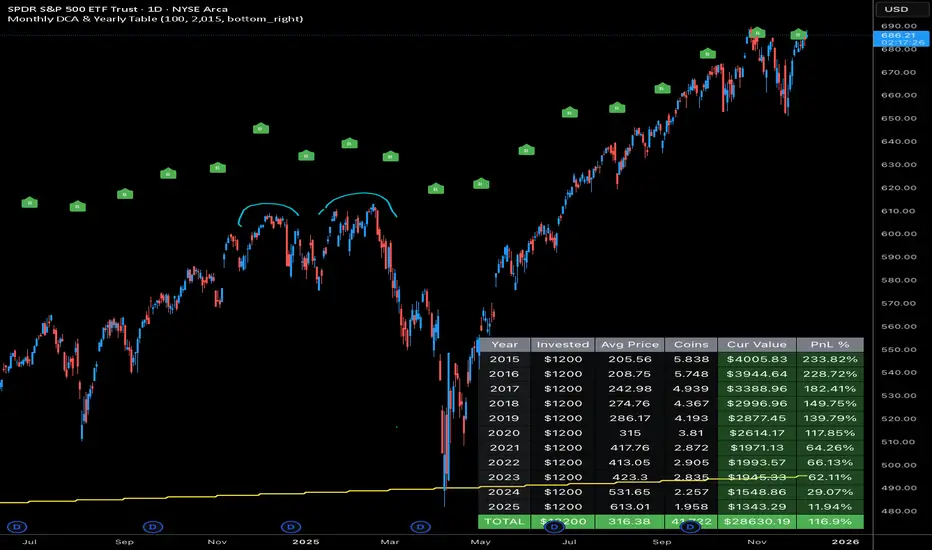
This Pine Script indicator simulates a Monthly Dollar Cost Averaging (DCA) strategy to help long-term investors visualize historical performance. Instead of complex timing, the script automatically executes a hypothetical fixed-dollar purchase (e.g., $100) on the first trading day of every month. It visually marks entry points with green "B" labels and plots a dynamic yellow line representing your Global Break-Even Price, allowing you to instantly see if the current price is above or below your average cost basis. To provide deep insight, it generates a detailed performance table in the bottom-right corner that breaks down metrics year-by-year—including total capital invested, shares/coins accumulated, and Profit/Loss percentage—along with a grand total summary of the entire investment period.
오픈 소스 스크립트
트레이딩뷰의 진정한 정신에 따라, 이 스크립트의 작성자는 이를 오픈소스로 공개하여 트레이더들이 기능을 검토하고 검증할 수 있도록 했습니다. 작성자에게 찬사를 보냅니다! 이 코드는 무료로 사용할 수 있지만, 코드를 재게시하는 경우 하우스 룰이 적용된다는 점을 기억하세요.

면책사항
해당 정보와 게시물은 금융, 투자, 트레이딩 또는 기타 유형의 조언이나 권장 사항으로 간주되지 않으며, 트레이딩뷰에서 제공하거나 보증하는 것이 아닙니다. 자세한 내용은 이용 약관을 참조하세요.
오픈 소스 스크립트
트레이딩뷰의 진정한 정신에 따라, 이 스크립트의 작성자는 이를 오픈소스로 공개하여 트레이더들이 기능을 검토하고 검증할 수 있도록 했습니다. 작성자에게 찬사를 보냅니다! 이 코드는 무료로 사용할 수 있지만, 코드를 재게시하는 경우 하우스 룰이 적용된다는 점을 기억하세요.
면책사항
해당 정보와 게시물은 금융, 투자, 트레이딩 또는 기타 유형의 조언이나 권장 사항으로 간주되지 않으며, 트레이딩뷰에서 제공하거나 보증하는 것이 아닙니다. 자세한 내용은 이용 약관을 참조하세요.