OPEN-SOURCE SCRIPT
ATR% Credit Spread Strike Guide
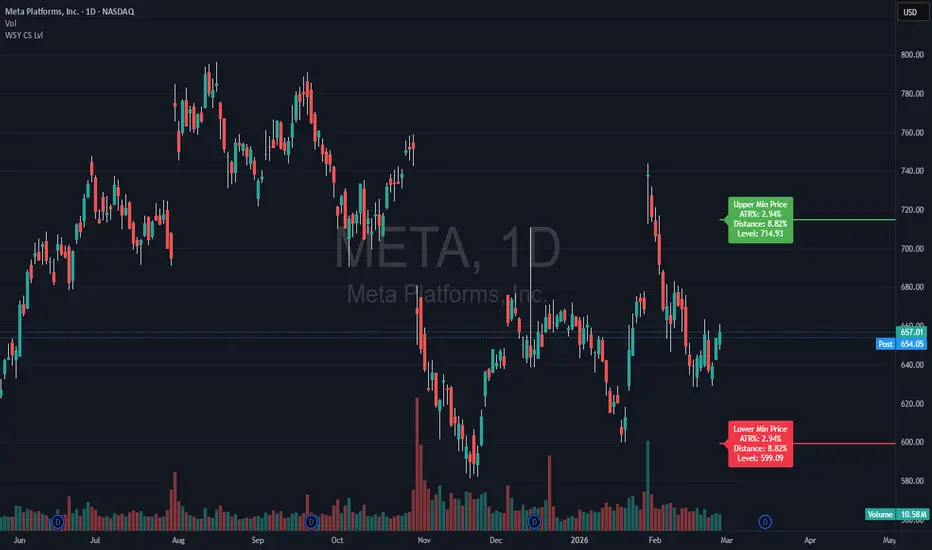
This indicator helps options traders quickly estimate the **nearest reasonable short strike area** for a credit spread using an **ATR-based distance model**.
It calculates the stock’s current **ATR%** and applies a user-defined multiple, then plots horizontal reference levels from the current price:
* **Lower Min Price** for the put side, useful when evaluating **bull put spreads**
* **Upper Min Price** for the call side, useful when evaluating **bear call spreads**
The goal is simple: instead of using a flat percentage for every stock, this tool adjusts the minimum strike distance based on the stock’s recent daily movement.
### How it works
* Uses **ATR over a selectable lookback period** (default: 20)
* Converts that movement into a percentage of price
* Applies a selectable **ATR% multiple** (1x to 4x, default: 3x)
* Draws a **horizontal line** at the current upper and/or lower threshold
* Optional labels show:
* ATR%
* Total distance %
* Current level price
### Why use it
A flat 5% rule can be too tight for volatile names and too wide for calmer names. This script gives a faster way to visualize a volatility-adjusted threshold before checking the actual option chain.
### Practical use
* Use the plotted level as the **closest strike area worth considering**
* Then confirm:
* option premium is acceptable
* return on risk meets your plan
* the strike still makes sense relative to expected move, trend, and support/resistance
### Important note
This is a **charting aid**, not a trade signal. It does not account for implied volatility, expected move, liquidity, earnings risk, assignment risk, or probability of touch. Always confirm with the option chain
It calculates the stock’s current **ATR%** and applies a user-defined multiple, then plots horizontal reference levels from the current price:
* **Lower Min Price** for the put side, useful when evaluating **bull put spreads**
* **Upper Min Price** for the call side, useful when evaluating **bear call spreads**
The goal is simple: instead of using a flat percentage for every stock, this tool adjusts the minimum strike distance based on the stock’s recent daily movement.
### How it works
* Uses **ATR over a selectable lookback period** (default: 20)
* Converts that movement into a percentage of price
* Applies a selectable **ATR% multiple** (1x to 4x, default: 3x)
* Draws a **horizontal line** at the current upper and/or lower threshold
* Optional labels show:
* ATR%
* Total distance %
* Current level price
### Why use it
A flat 5% rule can be too tight for volatile names and too wide for calmer names. This script gives a faster way to visualize a volatility-adjusted threshold before checking the actual option chain.
### Practical use
* Use the plotted level as the **closest strike area worth considering**
* Then confirm:
* option premium is acceptable
* return on risk meets your plan
* the strike still makes sense relative to expected move, trend, and support/resistance
### Important note
This is a **charting aid**, not a trade signal. It does not account for implied volatility, expected move, liquidity, earnings risk, assignment risk, or probability of touch. Always confirm with the option chain
오픈 소스 스크립트
트레이딩뷰의 진정한 정신에 따라, 이 스크립트의 작성자는 이를 오픈소스로 공개하여 트레이더들이 기능을 검토하고 검증할 수 있도록 했습니다. 작성자에게 찬사를 보냅니다! 이 코드는 무료로 사용할 수 있지만, 코드를 재게시하는 경우 하우스 룰이 적용된다는 점을 기억하세요.

Difficult Takes a day, Impossible Takes a Week!
면책사항
해당 정보와 게시물은 금융, 투자, 트레이딩 또는 기타 유형의 조언이나 권장 사항으로 간주되지 않으며, 트레이딩뷰에서 제공하거나 보증하는 것이 아닙니다. 자세한 내용은 이용 약관을 참조하세요.
오픈 소스 스크립트
트레이딩뷰의 진정한 정신에 따라, 이 스크립트의 작성자는 이를 오픈소스로 공개하여 트레이더들이 기능을 검토하고 검증할 수 있도록 했습니다. 작성자에게 찬사를 보냅니다! 이 코드는 무료로 사용할 수 있지만, 코드를 재게시하는 경우 하우스 룰이 적용된다는 점을 기억하세요.
Difficult Takes a day, Impossible Takes a Week!
면책사항
해당 정보와 게시물은 금융, 투자, 트레이딩 또는 기타 유형의 조언이나 권장 사항으로 간주되지 않으며, 트레이딩뷰에서 제공하거나 보증하는 것이 아닙니다. 자세한 내용은 이용 약관을 참조하세요.