OPEN-SOURCE SCRIPT
Edo Bands Fusion
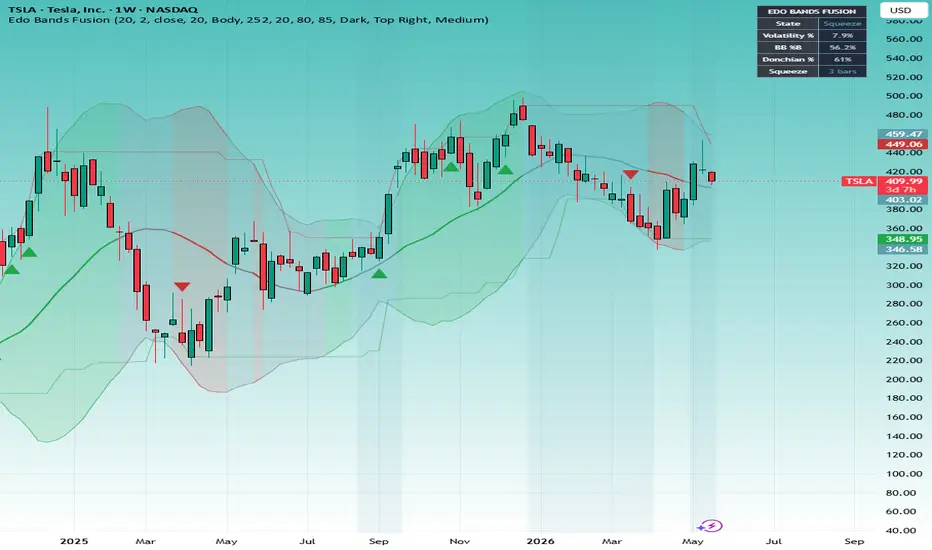
Edo Bands Fusion — Coordinated Volatility and Structure Reading with Bollinger Bands, Donchian Channels and Percentile Band Width on a Single Coordinated Overlay
Before opening a trade, three questions need to be answered: where is price relative to its statistical mean, where is price relative to the extremes of the recent range, and at what point of the volatility cycle is the asset. Each one has a classical indicator that answers it well — Bollinger Bands for the first, Donchian Channels for the second and a band-width reading for the third — but stacking three independent indicators on a single chart produces a noisy plot, three different color schemes and a panel that nobody reads in time.
Edo Bands Fusion was built to solve that. It fuses the three readings on a single coordinated overlay, paints all of them with the dominant state's color so the regime is identifiable at a glance, and condenses the full numeric reading into a compact 2×6 panel. The result is a complete framing of the market state on a single chart layer, with a single color scheme and a single reading flow.
WHAT THE INDICATOR DOES
Three classical layers, one coordinated state machine. The Bollinger layer measures statistical dispersion: how far price has moved from its mean in standard deviation terms. The Donchian layer measures absolute extremes: whether price has made a new high or low relative to the last N candles. The volatility percentile layer measures relative volatility: where current band width sits inside its own 252-bar history. Each layer answers one of the three questions, and a six-state classifier combines them into a single label — Squeeze, Expansion Up, Expansion Down, Trend Up, Trend Down or Range — that drives every color, marker and panel cell on the chart.
The three layers are deliberately independent of each other. Bollinger reacts to standard-deviation distance from the mean; Donchian only changes when a new absolute extreme prints; the percentile layer only updates when band width moves relative to its own history. When they coincide, the reading is robust. When they diverge — a Donchian breakout without statistical overheating in Bollinger, for example — that decoupling is itself a high-quality structural signal, and the indicator surfaces it.
THE THREE LAYERS
Bollinger Bands — statistical envelope.
20-period basis line plus upper and lower bands at 2 standard deviations of close (defaults configurable). The basis is plotted with width 2; bands are plotted with width 1 and a colored fill at 85% opacity by default. The fill is the key visual element of the indicator: its color updates bar by bar according to the dominant state, so the current regime is identifiable from a single glance at the chart without needing to read the panel. Green in Trend Up, red in Trend Down, neutral gray in Range, bluish in Squeeze.
Donchian Channels — range envelope.
Maximum and minimum of the last 20 candles by default, plotted as stepped lines (linebr style) that only change when a new extreme appears. Two computation modes are available. Body mode (default) uses max(open, close) and min(open, close), ignoring wicks — it produces a cleaner envelope and more structural breakouts, less sensitive to noise from individual wicks. Wick mode is classical and reacts to high/low directly, useful in assets where wicks are operationally relevant (actual stop levels, liquidity grabs). The upper Donchian is drawn in faded bear-red, the lower in faded bull-green, and an optional gray middle line is available as dynamic-stop reference.
Volatility Percentile (BBWP-style) — relative volatility.
The current relative width of the Bollinger Bands —(upper − lower) / basis × 100— is ranked through a percentile_rank function over the last 252 periods. The result is a value between 0 and 100 that is directly comparable across assets: a Volatility % of 10 means the same thing in NBIS as in BTC as in EURUSD — the market is in the bottom 10% of its own volatility history. Below the squeeze threshold (default 20%) the chart background is painted in faint blue. Above the expansion threshold (default 80%) the asset is in active volatility expansion.
STATE CLASSIFICATION
Each bar is classified into one of six states following a strict priority hierarchy:
— Squeeze — Volatility % below the squeeze threshold. Takes priority over every other state.
— Expansion Up — Close exceeds the upper Donchian of the previous period.
— Expansion Down — Close falls below the lower Donchian of the previous period.
— Trend Up — Price above the Bollinger basis AND basis with positive slope versus 5 bars ago.
— Trend Down — Price below the Bollinger basis AND basis with negative slope versus 5 bars ago.
— Range — None of the above. Default state when no clear direction is present.
This hierarchy gives Squeeze the highest weight (compression overrides everything because it is the most actionable structural state) and gives Donchian breakouts priority over Bollinger-only readings — when price has both crossed Bollinger and broken Donchian, the more structurally meaningful event is the Donchian breakout. The state machine drives the band color, the chart background, the panel and the alerts simultaneously.
DONCHIAN BREAKOUT MARKERS
Green triangles below the candle on the first bullish breakout, red triangles above the candle on the first bearish breakout. The "first" qualifier is deliberate: only the bar in which the close first exceeds the Donchian extreme is marked, not the following bars while the breakout persists. This avoids clusters of consecutive markers during sustained trends and keeps the chart clean. Breakout markers can be toggled on or off; they are enabled by default.
Operationally, breakout markers are confirmations of regime change, not entry signals per se. The decision to trade them depends on context — direction of the asset on higher timeframes, structure and duration of the prior range, behavior of the breakout candle itself.
INFORMATION PANEL
A compact 2-column, 6-row table on a configurable corner of the chart. Six rows that condense the full reading of the indicator:
— EDO BANDS FUSION — Header.
— State — Current state with its associated color.
— Volatility % — Current percentile rank of band width. 0% = lowest in history, 100% = highest.
— BB %B — Percentage position of price inside the Bollinger Bands. 0% at the lower band, 50% at the basis, 100% at the upper band.
— Donchian % — Percentage position of price inside the Donchian Channel.
— Squeeze — Counter of consecutive bars in squeeze state. Shows "—" when no compression is active.
The panel is positionable in all four corners (Top Right by default), has two sizes (Small / Medium) and switches automatically between Dark and Light themes to match the chart background.
ALERTS
Six predefined alerts cover the indicator's full event surface:
— Squeeze Started — Volatility % crosses below the squeeze threshold for the first time after a period of higher volatility.
— Squeeze Released — Volatility % recovers the normal zone after a period in squeeze. Often precedes a wide move.
— Donchian Breakout Up — First close above the upper Donchian of the previous period.
— Donchian Breakout Down — First close below the lower Donchian of the previous period.
— Price Crossed BB Upper — Price crosses the upper Bollinger band. Significant statistical deviation to the upside.
— Price Crossed BB Lower — Price crosses the lower Bollinger band. Significant statistical deviation to the downside.
The most profitable alerts in practice tend to be Squeeze Released and the two Donchian Breakout. Squeeze Started is useful as a pre-warning to prepare a trading plan. The two Bollinger cross alerts can be noisy in highly volatile assets — combining them with a higher-timeframe filter reduces false positives.
HOW TO READ IT
Four readings stacked on a single chart, with a recommended order.
1 — Read the band color first.
Color tells you the state in a fraction of a second. Green for Trend Up or Expansion Up, red for the bearish counterparts, gray for Range, blue for Squeeze. The fill is the most efficient input the indicator produces and the basis of every other reading.
2 — Read the background for compression.
If the background is bluish, the asset is in squeeze. Compression periods compress information and almost always release into wide moves. The Squeeze counter in the panel tells you how long the compression has lasted — long squeezes tend to release more decisively than short ones.
3 — Read the Donchian envelope for breakouts.
Stepped red and green lines mark the extremes of the last 20 candles. A close outside one of them — green triangle below, red triangle above — flags a structural change. Combined with squeeze, this becomes the cleanest setup the indicator produces.
4 — Use the panel for context.
BB %B tells you where price is inside the Bollinger Bands; Donchian % tells you where it is inside the Donchian range. Both are 0–100 readings comparable across assets. When BB %B is at 100 but Donchian % is at 80, price is statistically extended but has not yet made a new structural high — a momentum warning without a confirmed breakout.
COMMON PATTERNS
— Squeeze → Expansion.
A series of bars in Squeeze state (Volatility % < 20%, bluish background, narrow bands, growing Squeeze counter) followed by an abrupt change to Expansion Up or Expansion Down with its Donchian marker. The cleanest setup the indicator produces. Works especially well on 4H and Daily charts where compression collects more information.
— Persistent trend.
Price stays consistently above (or below) the Bollinger basis for many consecutive bars, Volatility % stays in the normal zone (40–70%) and price never touches the opposite extreme. Healthy trend that does not require immediate action — wait for the first Range bar to evaluate exhaustion.
— Bollinger extreme without Donchian breakout.
Close breaks the upper Bollinger band but stays inside the Donchian range. Strong impulse that has not yet generated a new absolute high — momentum warning, not entry signal. Wait for Donchian confirmation.
— Donchian breakout without Bollinger extreme.
Close exceeds the upper Donchian but Bollinger does not show statistical overextension. Clean structural breakout — new range high without overheating relative to the mean. Usually a higher-quality setup than breakouts with overextension.
CONFIGURATION
Full input customization grouped in seven blocks:
— Bollinger Bands: BB Length (20), StdDev Multiplier (2.0), Source (close), Show Bollinger Bands.
— Donchian Channels: Donchian Length (20), Mode (Body / Wick), Show Donchian Channels, Show Donchian Basis.
— Volatility State: Volatility Lookback (252), Squeeze Threshold (20%), Expansion Threshold (80%), Highlight Squeeze Background.
— Style: Bull Color, Bear Color, Neutral / Squeeze Color, BB Fill Opacity (85), Theme (Dark / Light).
— Markers: Show Donchian Breakout Markers.
— Panel: Show Panel, Position (Top Right / Top Left / Bottom Right / Bottom Left), Size (Small / Medium).
Defaults follow classical conventions (Bollinger 20/2, Donchian 20, BBWP 252) and are calibrated to work without tuning across stocks, crypto, forex, indices and futures.
OPEN SOURCE
Edo Bands Fusion is published as a free-access indicator within the Edolab Markets ecosystem. The full Pine Script v6 is publicly accessible on TradingView for study, adaptation and integration into any workflow. Part of the Edolab Markets free tools ecosystem alongside Edo SuperTrend Core, Edo RSI Dual, Edo Sentiment Map, Edo TRIX Core Cross and more available on TradingView.
This indicator is a technical analysis tool for educational and informational purposes only. It does not generate automatic buy or sell signals and should not be considered financial advice. Trading financial markets involves significant risk of capital loss. Past performance does not guarantee future results. Always use proper risk management.
Before opening a trade, three questions need to be answered: where is price relative to its statistical mean, where is price relative to the extremes of the recent range, and at what point of the volatility cycle is the asset. Each one has a classical indicator that answers it well — Bollinger Bands for the first, Donchian Channels for the second and a band-width reading for the third — but stacking three independent indicators on a single chart produces a noisy plot, three different color schemes and a panel that nobody reads in time.
Edo Bands Fusion was built to solve that. It fuses the three readings on a single coordinated overlay, paints all of them with the dominant state's color so the regime is identifiable at a glance, and condenses the full numeric reading into a compact 2×6 panel. The result is a complete framing of the market state on a single chart layer, with a single color scheme and a single reading flow.
WHAT THE INDICATOR DOES
Three classical layers, one coordinated state machine. The Bollinger layer measures statistical dispersion: how far price has moved from its mean in standard deviation terms. The Donchian layer measures absolute extremes: whether price has made a new high or low relative to the last N candles. The volatility percentile layer measures relative volatility: where current band width sits inside its own 252-bar history. Each layer answers one of the three questions, and a six-state classifier combines them into a single label — Squeeze, Expansion Up, Expansion Down, Trend Up, Trend Down or Range — that drives every color, marker and panel cell on the chart.
The three layers are deliberately independent of each other. Bollinger reacts to standard-deviation distance from the mean; Donchian only changes when a new absolute extreme prints; the percentile layer only updates when band width moves relative to its own history. When they coincide, the reading is robust. When they diverge — a Donchian breakout without statistical overheating in Bollinger, for example — that decoupling is itself a high-quality structural signal, and the indicator surfaces it.
THE THREE LAYERS
Bollinger Bands — statistical envelope.
20-period basis line plus upper and lower bands at 2 standard deviations of close (defaults configurable). The basis is plotted with width 2; bands are plotted with width 1 and a colored fill at 85% opacity by default. The fill is the key visual element of the indicator: its color updates bar by bar according to the dominant state, so the current regime is identifiable from a single glance at the chart without needing to read the panel. Green in Trend Up, red in Trend Down, neutral gray in Range, bluish in Squeeze.
Donchian Channels — range envelope.
Maximum and minimum of the last 20 candles by default, plotted as stepped lines (linebr style) that only change when a new extreme appears. Two computation modes are available. Body mode (default) uses max(open, close) and min(open, close), ignoring wicks — it produces a cleaner envelope and more structural breakouts, less sensitive to noise from individual wicks. Wick mode is classical and reacts to high/low directly, useful in assets where wicks are operationally relevant (actual stop levels, liquidity grabs). The upper Donchian is drawn in faded bear-red, the lower in faded bull-green, and an optional gray middle line is available as dynamic-stop reference.
Volatility Percentile (BBWP-style) — relative volatility.
The current relative width of the Bollinger Bands —(upper − lower) / basis × 100— is ranked through a percentile_rank function over the last 252 periods. The result is a value between 0 and 100 that is directly comparable across assets: a Volatility % of 10 means the same thing in NBIS as in BTC as in EURUSD — the market is in the bottom 10% of its own volatility history. Below the squeeze threshold (default 20%) the chart background is painted in faint blue. Above the expansion threshold (default 80%) the asset is in active volatility expansion.
STATE CLASSIFICATION
Each bar is classified into one of six states following a strict priority hierarchy:
— Squeeze — Volatility % below the squeeze threshold. Takes priority over every other state.
— Expansion Up — Close exceeds the upper Donchian of the previous period.
— Expansion Down — Close falls below the lower Donchian of the previous period.
— Trend Up — Price above the Bollinger basis AND basis with positive slope versus 5 bars ago.
— Trend Down — Price below the Bollinger basis AND basis with negative slope versus 5 bars ago.
— Range — None of the above. Default state when no clear direction is present.
This hierarchy gives Squeeze the highest weight (compression overrides everything because it is the most actionable structural state) and gives Donchian breakouts priority over Bollinger-only readings — when price has both crossed Bollinger and broken Donchian, the more structurally meaningful event is the Donchian breakout. The state machine drives the band color, the chart background, the panel and the alerts simultaneously.
DONCHIAN BREAKOUT MARKERS
Green triangles below the candle on the first bullish breakout, red triangles above the candle on the first bearish breakout. The "first" qualifier is deliberate: only the bar in which the close first exceeds the Donchian extreme is marked, not the following bars while the breakout persists. This avoids clusters of consecutive markers during sustained trends and keeps the chart clean. Breakout markers can be toggled on or off; they are enabled by default.
Operationally, breakout markers are confirmations of regime change, not entry signals per se. The decision to trade them depends on context — direction of the asset on higher timeframes, structure and duration of the prior range, behavior of the breakout candle itself.
INFORMATION PANEL
A compact 2-column, 6-row table on a configurable corner of the chart. Six rows that condense the full reading of the indicator:
— EDO BANDS FUSION — Header.
— State — Current state with its associated color.
— Volatility % — Current percentile rank of band width. 0% = lowest in history, 100% = highest.
— BB %B — Percentage position of price inside the Bollinger Bands. 0% at the lower band, 50% at the basis, 100% at the upper band.
— Donchian % — Percentage position of price inside the Donchian Channel.
— Squeeze — Counter of consecutive bars in squeeze state. Shows "—" when no compression is active.
The panel is positionable in all four corners (Top Right by default), has two sizes (Small / Medium) and switches automatically between Dark and Light themes to match the chart background.
ALERTS
Six predefined alerts cover the indicator's full event surface:
— Squeeze Started — Volatility % crosses below the squeeze threshold for the first time after a period of higher volatility.
— Squeeze Released — Volatility % recovers the normal zone after a period in squeeze. Often precedes a wide move.
— Donchian Breakout Up — First close above the upper Donchian of the previous period.
— Donchian Breakout Down — First close below the lower Donchian of the previous period.
— Price Crossed BB Upper — Price crosses the upper Bollinger band. Significant statistical deviation to the upside.
— Price Crossed BB Lower — Price crosses the lower Bollinger band. Significant statistical deviation to the downside.
The most profitable alerts in practice tend to be Squeeze Released and the two Donchian Breakout. Squeeze Started is useful as a pre-warning to prepare a trading plan. The two Bollinger cross alerts can be noisy in highly volatile assets — combining them with a higher-timeframe filter reduces false positives.
HOW TO READ IT
Four readings stacked on a single chart, with a recommended order.
1 — Read the band color first.
Color tells you the state in a fraction of a second. Green for Trend Up or Expansion Up, red for the bearish counterparts, gray for Range, blue for Squeeze. The fill is the most efficient input the indicator produces and the basis of every other reading.
2 — Read the background for compression.
If the background is bluish, the asset is in squeeze. Compression periods compress information and almost always release into wide moves. The Squeeze counter in the panel tells you how long the compression has lasted — long squeezes tend to release more decisively than short ones.
3 — Read the Donchian envelope for breakouts.
Stepped red and green lines mark the extremes of the last 20 candles. A close outside one of them — green triangle below, red triangle above — flags a structural change. Combined with squeeze, this becomes the cleanest setup the indicator produces.
4 — Use the panel for context.
BB %B tells you where price is inside the Bollinger Bands; Donchian % tells you where it is inside the Donchian range. Both are 0–100 readings comparable across assets. When BB %B is at 100 but Donchian % is at 80, price is statistically extended but has not yet made a new structural high — a momentum warning without a confirmed breakout.
COMMON PATTERNS
— Squeeze → Expansion.
A series of bars in Squeeze state (Volatility % < 20%, bluish background, narrow bands, growing Squeeze counter) followed by an abrupt change to Expansion Up or Expansion Down with its Donchian marker. The cleanest setup the indicator produces. Works especially well on 4H and Daily charts where compression collects more information.
— Persistent trend.
Price stays consistently above (or below) the Bollinger basis for many consecutive bars, Volatility % stays in the normal zone (40–70%) and price never touches the opposite extreme. Healthy trend that does not require immediate action — wait for the first Range bar to evaluate exhaustion.
— Bollinger extreme without Donchian breakout.
Close breaks the upper Bollinger band but stays inside the Donchian range. Strong impulse that has not yet generated a new absolute high — momentum warning, not entry signal. Wait for Donchian confirmation.
— Donchian breakout without Bollinger extreme.
Close exceeds the upper Donchian but Bollinger does not show statistical overextension. Clean structural breakout — new range high without overheating relative to the mean. Usually a higher-quality setup than breakouts with overextension.
CONFIGURATION
Full input customization grouped in seven blocks:
— Bollinger Bands: BB Length (20), StdDev Multiplier (2.0), Source (close), Show Bollinger Bands.
— Donchian Channels: Donchian Length (20), Mode (Body / Wick), Show Donchian Channels, Show Donchian Basis.
— Volatility State: Volatility Lookback (252), Squeeze Threshold (20%), Expansion Threshold (80%), Highlight Squeeze Background.
— Style: Bull Color, Bear Color, Neutral / Squeeze Color, BB Fill Opacity (85), Theme (Dark / Light).
— Markers: Show Donchian Breakout Markers.
— Panel: Show Panel, Position (Top Right / Top Left / Bottom Right / Bottom Left), Size (Small / Medium).
Defaults follow classical conventions (Bollinger 20/2, Donchian 20, BBWP 252) and are calibrated to work without tuning across stocks, crypto, forex, indices and futures.
OPEN SOURCE
Edo Bands Fusion is published as a free-access indicator within the Edolab Markets ecosystem. The full Pine Script v6 is publicly accessible on TradingView for study, adaptation and integration into any workflow. Part of the Edolab Markets free tools ecosystem alongside Edo SuperTrend Core, Edo RSI Dual, Edo Sentiment Map, Edo TRIX Core Cross and more available on TradingView.
This indicator is a technical analysis tool for educational and informational purposes only. It does not generate automatic buy or sell signals and should not be considered financial advice. Trading financial markets involves significant risk of capital loss. Past performance does not guarantee future results. Always use proper risk management.
오픈 소스 스크립트
트레이딩뷰의 진정한 정신에 따라, 이 스크립트의 작성자는 이를 오픈소스로 공개하여 트레이더들이 기능을 검토하고 검증할 수 있도록 했습니다. 작성자에게 찬사를 보냅니다! 이 코드는 무료로 사용할 수 있지만, 코드를 재게시하는 경우 하우스 룰이 적용된다는 점을 기억하세요.

EdoLab Markets – Precision Trading Tools
Get Exclusive Indicators:
edolab.io
All content provided is for informational and educational purposes only. Past performance does not guarantee future results.
Get Exclusive Indicators:
edolab.io
All content provided is for informational and educational purposes only. Past performance does not guarantee future results.
면책사항
해당 정보와 게시물은 금융, 투자, 트레이딩 또는 기타 유형의 조언이나 권장 사항으로 간주되지 않으며, 트레이딩뷰에서 제공하거나 보증하는 것이 아닙니다. 자세한 내용은 이용 약관을 참조하세요.
오픈 소스 스크립트
트레이딩뷰의 진정한 정신에 따라, 이 스크립트의 작성자는 이를 오픈소스로 공개하여 트레이더들이 기능을 검토하고 검증할 수 있도록 했습니다. 작성자에게 찬사를 보냅니다! 이 코드는 무료로 사용할 수 있지만, 코드를 재게시하는 경우 하우스 룰이 적용된다는 점을 기억하세요.
EdoLab Markets – Precision Trading Tools
Get Exclusive Indicators:
edolab.io
All content provided is for informational and educational purposes only. Past performance does not guarantee future results.
Get Exclusive Indicators:
edolab.io
All content provided is for informational and educational purposes only. Past performance does not guarantee future results.
면책사항
해당 정보와 게시물은 금융, 투자, 트레이딩 또는 기타 유형의 조언이나 권장 사항으로 간주되지 않으며, 트레이딩뷰에서 제공하거나 보증하는 것이 아닙니다. 자세한 내용은 이용 약관을 참조하세요.