Stochastic Full Weighted 14-6-14 PRIMUS
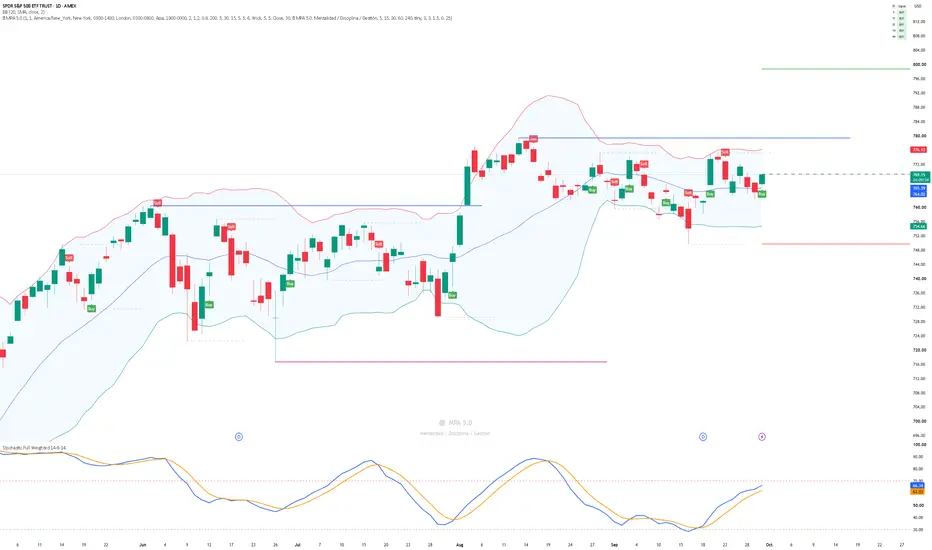
Stochastic Full Weighted 14-6-14
This indicator is a Full Weighted Stochastic Oscillator configured with 14-6-14 settings.
The Full K line, shown in blue, is calculated by smoothing the 14-period Fast Stochastic using a 14-period Weighted Moving Average (WMA). The Full D line, shown in orange, is a 6-period WMA of the Full K line.
Settings:
- Stochastic period: 14
- Full K smoothing: 14-period WMA
- Full D smoothing: 6-period WMA
- Overbought level: 70
- Oversold level: 30
Interpretation:
- A bullish crossover occurs when Full K crosses above Full D and may indicate increasing upward momentum.
- A bearish crossover occurs when Full K crosses below Full D and may indicate increasing downward momentum.
- Bullish crossovers below 30 may help identify potential upward reversals.
- Bearish crossovers above 70 may help identify potential downward reversals.
- Signals should be confirmed using price action, volume, and the overall market trend.
This indicator does not execute trades automatically and is intended for educational and analytical purposes only. It is not financial advice. Always test the indicator thoroughly before using it with real capital.
This indicator is a Full Weighted Stochastic Oscillator configured with 14-6-14 settings.
The Full K line, shown in blue, is calculated by smoothing the 14-period Fast Stochastic using a 14-period Weighted Moving Average (WMA). The Full D line, shown in orange, is a 6-period WMA of the Full K line.
Settings:
- Stochastic period: 14
- Full K smoothing: 14-period WMA
- Full D smoothing: 6-period WMA
- Overbought level: 70
- Oversold level: 30
Interpretation:
- A bullish crossover occurs when Full K crosses above Full D and may indicate increasing upward momentum.
- A bearish crossover occurs when Full K crosses below Full D and may indicate increasing downward momentum.
- Bullish crossovers below 30 may help identify potential upward reversals.
- Bearish crossovers above 70 may help identify potential downward reversals.
- Signals should be confirmed using price action, volume, and the overall market trend.
This indicator does not execute trades automatically and is intended for educational and analytical purposes only. It is not financial advice. Always test the indicator thoroughly before using it with real capital.

면책사항
해당 정보와 게시물은 금융, 투자, 트레이딩 또는 기타 유형의 조언이나 권장 사항으로 간주되지 않으며, 트레이딩뷰에서 제공하거나 보증하는 것이 아닙니다. 자세한 내용은 이용 약관을 참조하세요.
면책사항
해당 정보와 게시물은 금융, 투자, 트레이딩 또는 기타 유형의 조언이나 권장 사항으로 간주되지 않으며, 트레이딩뷰에서 제공하거나 보증하는 것이 아닙니다. 자세한 내용은 이용 약관을 참조하세요.