OPEN-SOURCE SCRIPT
업데이트됨 OBV Trend Candles
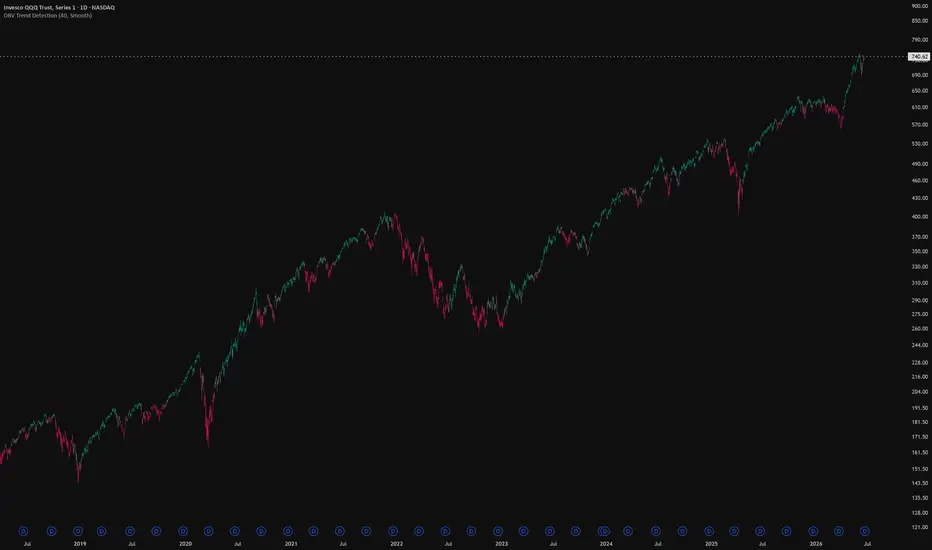
OBV Trend Candles
This indicator colors your candles based on the relationship between On-Balance Volume (OBV) and a moving average of OBV. It's a simple way to keep volume-based trend context visible directly on the price chart, without having to watch a separate OBV pane.
How it works
OBV accumulates volume on up-closes and subtracts it on down-closes, so a rising OBV means volume is flowing into the asset and a falling OBV means it's flowing out. This script takes that OBV line and compares it to a simple moving average of itself:
When OBV is above its SMA, volume momentum is building → candles are painted green.
When OBV is below its SMA, volume momentum is fading → candles are painted red.
The idea is that volume often shifts before or alongside price, so the color flips can give you a read on whether the current move is backed by participation.
The Sensitivity input
The single setting that matters is Sensitivity, which is the length of the SMA applied to OBV. Lower values make the indicator react faster to changes in volume flow (more color flips, more noise), while higher values smooth things out and only flip on more established shifts. Tune it to your timeframe and trading style — there's no universally "correct" value.
Notes
It works on any timeframe and any asset, as long as that asset reports volume data. On symbols without volume (some forex pairs and certain indices), OBV can't be calculated and the script will let you know. Colors are fully customizable in the settings.
This is a context/confirmation tool, not a standalone signal — it tells you about volume flow, not where to enter or exit. Use it alongside your own analysis.
This indicator colors your candles based on the relationship between On-Balance Volume (OBV) and a moving average of OBV. It's a simple way to keep volume-based trend context visible directly on the price chart, without having to watch a separate OBV pane.
How it works
OBV accumulates volume on up-closes and subtracts it on down-closes, so a rising OBV means volume is flowing into the asset and a falling OBV means it's flowing out. This script takes that OBV line and compares it to a simple moving average of itself:
When OBV is above its SMA, volume momentum is building → candles are painted green.
When OBV is below its SMA, volume momentum is fading → candles are painted red.
The idea is that volume often shifts before or alongside price, so the color flips can give you a read on whether the current move is backed by participation.
The Sensitivity input
The single setting that matters is Sensitivity, which is the length of the SMA applied to OBV. Lower values make the indicator react faster to changes in volume flow (more color flips, more noise), while higher values smooth things out and only flip on more established shifts. Tune it to your timeframe and trading style — there's no universally "correct" value.
Notes
It works on any timeframe and any asset, as long as that asset reports volume data. On symbols without volume (some forex pairs and certain indices), OBV can't be calculated and the script will let you know. Colors are fully customizable in the settings.
This is a context/confirmation tool, not a standalone signal — it tells you about volume flow, not where to enter or exit. Use it alongside your own analysis.
릴리즈 노트
Adding a color flip transition selector.릴리즈 노트
Small display adjustment릴리즈 노트
Changed the indicator names to OBV Trend Detection오픈 소스 스크립트
트레이딩뷰의 진정한 정신에 따라, 이 스크립트의 작성자는 이를 오픈소스로 공개하여 트레이더들이 기능을 검토하고 검증할 수 있도록 했습니다. 작성자에게 찬사를 보냅니다! 이 코드는 무료로 사용할 수 있지만, 코드를 재게시하는 경우 하우스 룰이 적용된다는 점을 기억하세요.

atreidis.app/ Know what regime Bitcoin is in, daily.
Built by a Bitcoiner who got tired of riding the chart down 70%+ every cycle. One dashboard. One color-coded signal. Read the market at a glance.
Built by a Bitcoiner who got tired of riding the chart down 70%+ every cycle. One dashboard. One color-coded signal. Read the market at a glance.
면책사항
해당 정보와 게시물은 금융, 투자, 트레이딩 또는 기타 유형의 조언이나 권장 사항으로 간주되지 않으며, 트레이딩뷰에서 제공하거나 보증하는 것이 아닙니다. 자세한 내용은 이용 약관을 참조하세요.
오픈 소스 스크립트
트레이딩뷰의 진정한 정신에 따라, 이 스크립트의 작성자는 이를 오픈소스로 공개하여 트레이더들이 기능을 검토하고 검증할 수 있도록 했습니다. 작성자에게 찬사를 보냅니다! 이 코드는 무료로 사용할 수 있지만, 코드를 재게시하는 경우 하우스 룰이 적용된다는 점을 기억하세요.
atreidis.app/ Know what regime Bitcoin is in, daily.
Built by a Bitcoiner who got tired of riding the chart down 70%+ every cycle. One dashboard. One color-coded signal. Read the market at a glance.
Built by a Bitcoiner who got tired of riding the chart down 70%+ every cycle. One dashboard. One color-coded signal. Read the market at a glance.
면책사항
해당 정보와 게시물은 금융, 투자, 트레이딩 또는 기타 유형의 조언이나 권장 사항으로 간주되지 않으며, 트레이딩뷰에서 제공하거나 보증하는 것이 아닙니다. 자세한 내용은 이용 약관을 참조하세요.