OPEN-SOURCE SCRIPT
CandelaCharts - HTF Mappings
📝 Overview
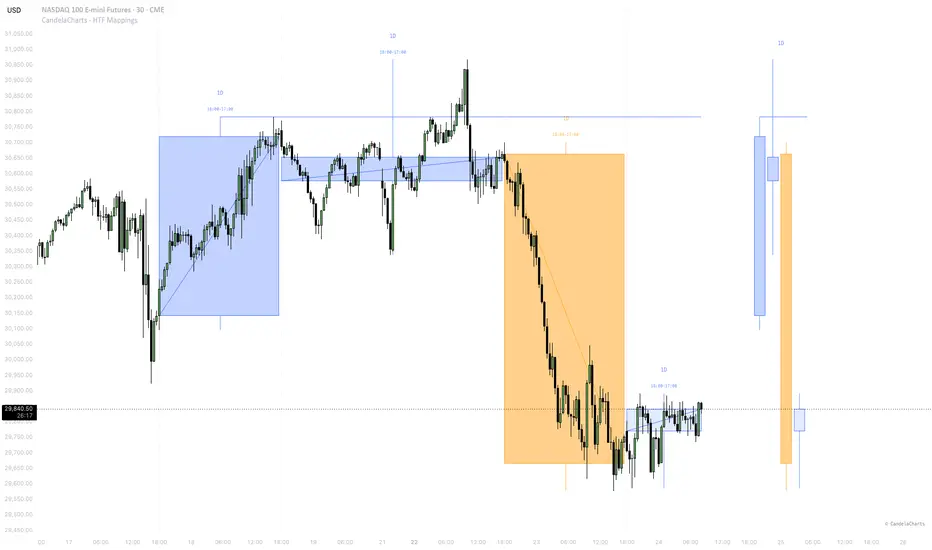
The CandelaCharts - HTF Mappings indicator seamlessly overlays higher timeframe (HTF) candles directly onto your current chart. It allows traders to visualize the broader market context without switching timeframes, making it easier to spot macro trends, support/resistance, and price action dynamics.
📦 Features
⚙️ Settings
⚡️ Showcase
Mapped HTF Candles

HTF Sweeps

HTF Overlays with Trend Lines

Dual HTF Overlays

🚨 Alerts
⚠️ Disclaimer
Trading involves significant risk, and many participants may incur losses. The content on this site is not intended as financial advice and should not be interpreted as such. Decisions to buy, sell, hold, or trade securities, commodities, or other financial instruments carry inherent risks and are best made with guidance from qualified financial professionals. Past performance is not indicative of future results.
The CandelaCharts - HTF Mappings indicator seamlessly overlays higher timeframe (HTF) candles directly onto your current chart. It allows traders to visualize the broader market context without switching timeframes, making it easier to spot macro trends, support/resistance, and price action dynamics.
📦 Features
- Dual HTF Overlays: Display up to two distinct higher timeframe candles simultaneously.
- Right-Side Panel: View the current state of your selected HTFs elegantly displayed on the right margin.
- Volatility-Adjusted Opacity: Candle bodies dynamically adjust their opacity based on the Average True Range (ATR), giving you a visual representation of market volatility.
- Historical Candles: Project a defined number of past HTF candles to analyze previous price action on a macro level.
- HTF Sweeps: Automatically detect and project liquidity sweep lines from mapped HTF candles. Sweeps precisely anchor to the HTF high/low wicks and persist until crossed by current price action.
- Trend Lines: Optionally draw a trend line connecting the open and close prices within each mapped HTF candle to track internal momentum.
- Customizable Visuals: Full control over colors, wick widths, vertical separators, and timeframe/time labels.
⚙️ Settings
- Timezone: Set the timezone used for displaying candle timestamps.
- HTF I & II: Configure the timeframes, historical count, colors (bull/bear, body/border), wicks, separators, trend lines, and label visibilities for each HTF.
- Sweeps: Customize sweep line colors, width, styling, and selectively display or hide invalidated (crossed) sweeps.
- HTF Settings: Adjust the position, spacing, margin, and size of the right-side HTF panel.
⚡️ Showcase
Mapped HTF Candles
HTF Sweeps
HTF Overlays with Trend Lines
Dual HTF Overlays
🚨 Alerts
- New HTF Candle: Triggers an alert whenever a new higher timeframe candle opens, keeping you updated on macro shifts without having to constantly monitor the chart.
⚠️ Disclaimer
Trading involves significant risk, and many participants may incur losses. The content on this site is not intended as financial advice and should not be interpreted as such. Decisions to buy, sell, hold, or trade securities, commodities, or other financial instruments carry inherent risks and are best made with guidance from qualified financial professionals. Past performance is not indicative of future results.
오픈 소스 스크립트
트레이딩뷰의 진정한 정신에 따라, 이 스크립트의 작성자는 이를 오픈소스로 공개하여 트레이더들이 기능을 검토하고 검증할 수 있도록 했습니다. 작성자에게 찬사를 보냅니다! 이 코드는 무료로 사용할 수 있지만, 코드를 재게시하는 경우 하우스 룰이 적용된다는 점을 기억하세요.

🔵 Tools that give you the edge: candelacharts.com/.
🔵 Join our free discord for updates: candelacharts.com/community
🔵 Join our free discord for updates: candelacharts.com/community
면책사항
해당 정보와 게시물은 금융, 투자, 트레이딩 또는 기타 유형의 조언이나 권장 사항으로 간주되지 않으며, 트레이딩뷰에서 제공하거나 보증하는 것이 아닙니다. 자세한 내용은 이용 약관을 참조하세요.
오픈 소스 스크립트
트레이딩뷰의 진정한 정신에 따라, 이 스크립트의 작성자는 이를 오픈소스로 공개하여 트레이더들이 기능을 검토하고 검증할 수 있도록 했습니다. 작성자에게 찬사를 보냅니다! 이 코드는 무료로 사용할 수 있지만, 코드를 재게시하는 경우 하우스 룰이 적용된다는 점을 기억하세요.
🔵 Tools that give you the edge: candelacharts.com/.
🔵 Join our free discord for updates: candelacharts.com/community
🔵 Join our free discord for updates: candelacharts.com/community
면책사항
해당 정보와 게시물은 금융, 투자, 트레이딩 또는 기타 유형의 조언이나 권장 사항으로 간주되지 않으며, 트레이딩뷰에서 제공하거나 보증하는 것이 아닙니다. 자세한 내용은 이용 약관을 참조하세요.