OPEN-SOURCE SCRIPT
50-MA Extension Dot [ATR / % / Points]
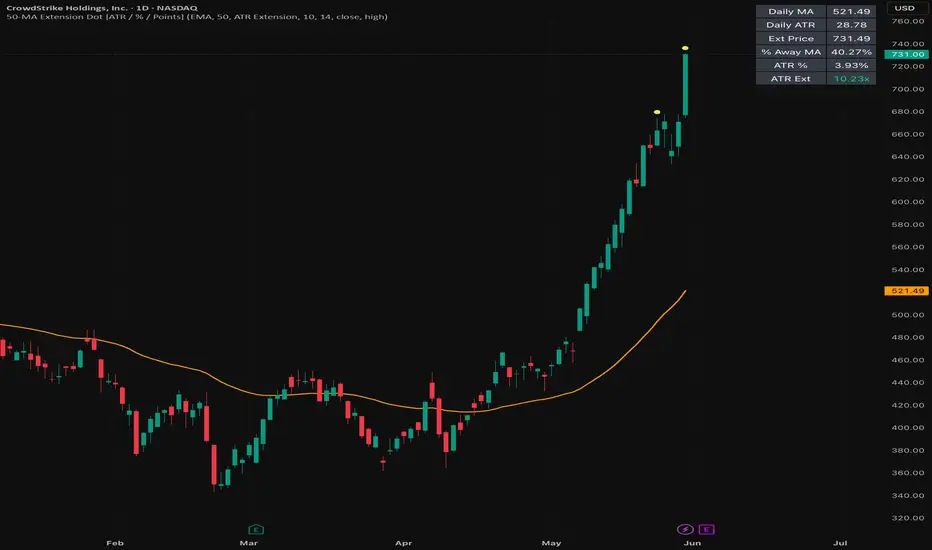
50-MA Extension Dot [ATR / % / Points] marks when price has moved a defined distance above a daily moving-average anchor. The goal of the script is to help traders study when price becomes extended relative to its daily trend structure, rather than judging a move by price alone.
The script supports three extension methods: ATR Extension, Percent, and Points. ATR Extension compares the distance from price to the daily moving average against the instrument’s daily ATR, making the reading volatility-adjusted. Percent mode measures how far price is above the moving average in percentage terms. Points mode measures the raw point distance above the moving-average anchor.
The moving-average type, moving-average length, threshold method, threshold value, ATR length, and extension source are customizable so traders can study past moves and build their own rules. For example, users can test how a symbol historically behaved when it became one ATR, two ATRs, a fixed percentage, or a fixed point distance above its daily moving-average reference.
When the selected threshold is reached, the script plots a small dot above the candle. The dot is not a standalone buy or sell signal. It is a visual marker showing that price has reached a defined extension zone relative to the chosen daily moving-average reference.
The script can also display the daily moving average, an optional threshold line, and a small table showing the current daily moving average, daily ATR, extension price, percentage distance from the moving average, ATR percentage, and ATR extension value.
This tool is useful for studying stretched moves, breakout extensions, momentum exhaustion, and conditions where price may be moving too far too quickly above its daily trend anchor. Because different symbols have different volatility profiles, the customizable inputs allow traders to compare past extensions and develop rules that fit their own process.
This indicator does not predict future price movement. It is a contextual extension tool designed to measure distance from a daily trend reference and help traders research historical extension behavior.
The script supports three extension methods: ATR Extension, Percent, and Points. ATR Extension compares the distance from price to the daily moving average against the instrument’s daily ATR, making the reading volatility-adjusted. Percent mode measures how far price is above the moving average in percentage terms. Points mode measures the raw point distance above the moving-average anchor.
The moving-average type, moving-average length, threshold method, threshold value, ATR length, and extension source are customizable so traders can study past moves and build their own rules. For example, users can test how a symbol historically behaved when it became one ATR, two ATRs, a fixed percentage, or a fixed point distance above its daily moving-average reference.
When the selected threshold is reached, the script plots a small dot above the candle. The dot is not a standalone buy or sell signal. It is a visual marker showing that price has reached a defined extension zone relative to the chosen daily moving-average reference.
The script can also display the daily moving average, an optional threshold line, and a small table showing the current daily moving average, daily ATR, extension price, percentage distance from the moving average, ATR percentage, and ATR extension value.
This tool is useful for studying stretched moves, breakout extensions, momentum exhaustion, and conditions where price may be moving too far too quickly above its daily trend anchor. Because different symbols have different volatility profiles, the customizable inputs allow traders to compare past extensions and develop rules that fit their own process.
This indicator does not predict future price movement. It is a contextual extension tool designed to measure distance from a daily trend reference and help traders research historical extension behavior.
오픈 소스 스크립트
트레이딩뷰의 진정한 정신에 따라, 이 스크립트의 작성자는 이를 오픈소스로 공개하여 트레이더들이 기능을 검토하고 검증할 수 있도록 했습니다. 작성자에게 찬사를 보냅니다! 이 코드는 무료로 사용할 수 있지만, 코드를 재게시하는 경우 하우스 룰이 적용된다는 점을 기억하세요.

Independent market structure tools and educational chart analysis for learning and review only. Not financial advice.
면책사항
해당 정보와 게시물은 금융, 투자, 트레이딩 또는 기타 유형의 조언이나 권장 사항으로 간주되지 않으며, 트레이딩뷰에서 제공하거나 보증하는 것이 아닙니다. 자세한 내용은 이용 약관을 참조하세요.
오픈 소스 스크립트
트레이딩뷰의 진정한 정신에 따라, 이 스크립트의 작성자는 이를 오픈소스로 공개하여 트레이더들이 기능을 검토하고 검증할 수 있도록 했습니다. 작성자에게 찬사를 보냅니다! 이 코드는 무료로 사용할 수 있지만, 코드를 재게시하는 경우 하우스 룰이 적용된다는 점을 기억하세요.
Independent market structure tools and educational chart analysis for learning and review only. Not financial advice.
면책사항
해당 정보와 게시물은 금융, 투자, 트레이딩 또는 기타 유형의 조언이나 권장 사항으로 간주되지 않으며, 트레이딩뷰에서 제공하거나 보증하는 것이 아닙니다. 자세한 내용은 이용 약관을 참조하세요.