OPEN-SOURCE SCRIPT
업데이트됨 Intraday EMA
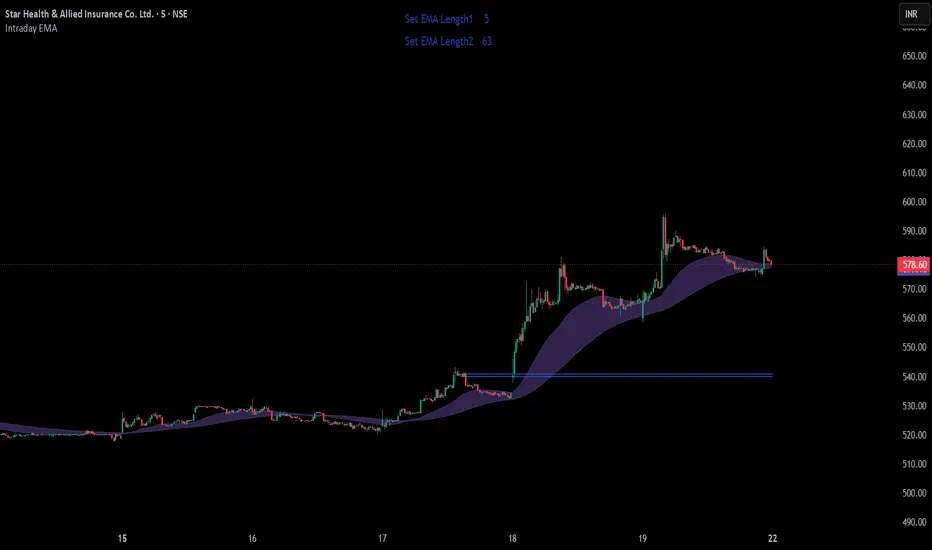
Short Description
Dynamic EMA Envelope based on recent hourly high/low structure with optional single EMA mode.
Full Publishing Description
Intraday EMA Envelope
Intraday EMA Envelope is a lightweight trend-following indicator designed for intraday traders who want adaptive EMA-based structure visualization.
The script derives EMA reference lengths from recent hourly market behavior using highest and lowest price offsets over a configurable lookback period.
Features
• Adaptive EMA logic based on hourly market structure
• Optional Single EMA mode
• EMA Envelope visualization with fill zone
• Smooth EMA calculations for cleaner trend tracking
• Real-time EMA length display table
• Mutually exclusive display modes for clean chart appearance
How It Works
The indicator scans hourly candles over the selected lookback period and calculates:
Highest high offset
Lowest low offset
These offsets are converted into dynamic EMA reference lengths.
Two smoothed EMAs are then plotted:
Upper EMA
Lower EMA
Users can choose between:
Single EMA mode
EMA Envelope mode
Both modes are intentionally made mutually exclusive to avoid chart clutter.
Inputs
• Lookback Days
Controls the hourly historical range used for EMA calculations.
• Show Single EMA
Displays only one smoothed EMA.
• Show EMA Envelope
Displays the EMA channel/envelope with fill.
Best Usage
This indicator works best for:
Intraday trend identification
Pullback trading
Dynamic support/resistance tracking
Trend continuation setups
Dynamic EMA Envelope based on recent hourly high/low structure with optional single EMA mode.
Full Publishing Description
Intraday EMA Envelope
Intraday EMA Envelope is a lightweight trend-following indicator designed for intraday traders who want adaptive EMA-based structure visualization.
The script derives EMA reference lengths from recent hourly market behavior using highest and lowest price offsets over a configurable lookback period.
Features
• Adaptive EMA logic based on hourly market structure
• Optional Single EMA mode
• EMA Envelope visualization with fill zone
• Smooth EMA calculations for cleaner trend tracking
• Real-time EMA length display table
• Mutually exclusive display modes for clean chart appearance
How It Works
The indicator scans hourly candles over the selected lookback period and calculates:
Highest high offset
Lowest low offset
These offsets are converted into dynamic EMA reference lengths.
Two smoothed EMAs are then plotted:
Upper EMA
Lower EMA
Users can choose between:
Single EMA mode
EMA Envelope mode
Both modes are intentionally made mutually exclusive to avoid chart clutter.
Inputs
• Lookback Days
Controls the hourly historical range used for EMA calculations.
• Show Single EMA
Displays only one smoothed EMA.
• Show EMA Envelope
Displays the EMA channel/envelope with fill.
Best Usage
This indicator works best for:
Intraday trend identification
Pullback trading
Dynamic support/resistance tracking
Trend continuation setups
릴리즈 노트
Added :- EMA Cycle Confluence Detector [LCM Based]""Identifies synchronization points between two EMA cycle lengths using Least Common Multiple (LCM) calculations and automatically plots the latest confluence high-low zone for support and resistance analysis."
오픈 소스 스크립트
트레이딩뷰의 진정한 정신에 따라, 이 스크립트의 작성자는 이를 오픈소스로 공개하여 트레이더들이 기능을 검토하고 검증할 수 있도록 했습니다. 작성자에게 찬사를 보냅니다! 이 코드는 무료로 사용할 수 있지만, 코드를 재게시하는 경우 하우스 룰이 적용된다는 점을 기억하세요.

면책사항
해당 정보와 게시물은 금융, 투자, 트레이딩 또는 기타 유형의 조언이나 권장 사항으로 간주되지 않으며, 트레이딩뷰에서 제공하거나 보증하는 것이 아닙니다. 자세한 내용은 이용 약관을 참조하세요.
오픈 소스 스크립트
트레이딩뷰의 진정한 정신에 따라, 이 스크립트의 작성자는 이를 오픈소스로 공개하여 트레이더들이 기능을 검토하고 검증할 수 있도록 했습니다. 작성자에게 찬사를 보냅니다! 이 코드는 무료로 사용할 수 있지만, 코드를 재게시하는 경우 하우스 룰이 적용된다는 점을 기억하세요.
면책사항
해당 정보와 게시물은 금융, 투자, 트레이딩 또는 기타 유형의 조언이나 권장 사항으로 간주되지 않으며, 트레이딩뷰에서 제공하거나 보증하는 것이 아닙니다. 자세한 내용은 이용 약관을 참조하세요.