OPEN-SOURCE SCRIPT
MAGIC Auto Fib Extension Entry SL TP with Win Loss Stats
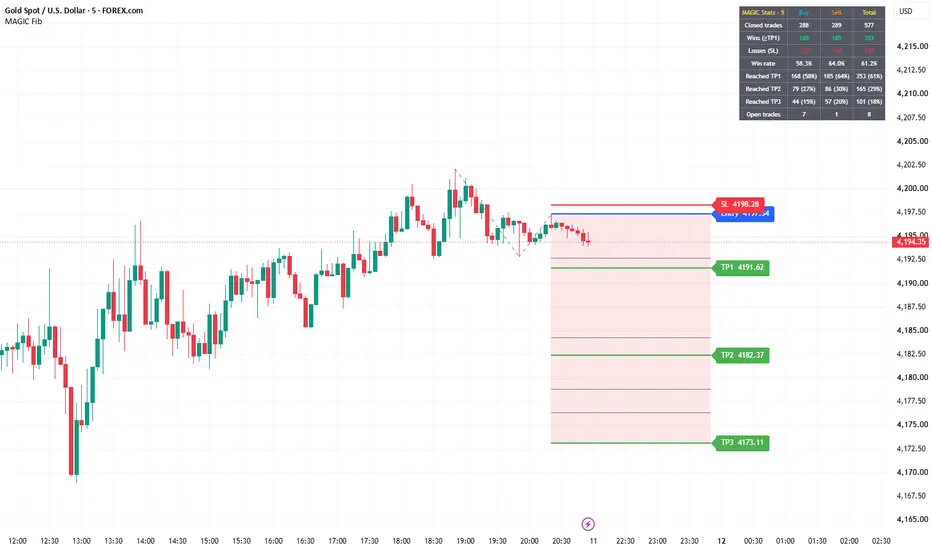
MAGIC Auto Fib Extension automatically finds market swings and draws a Trend-Based Fibonacci Extension with ready-made Entry, Stop Loss and three Take Profit levels — plus a dashboard that tracks how every past signal performed.
HOW IT WORKS
1. Swing detection
The script uses pivot highs and lows (adjustable left/right bars) to build an alternating chain of swing points.
2. A → B → C pattern
- Bullish: A = swing low, B = swing high, C = higher low between A and B.
- Bearish: A = swing high, B = swing low, C = lower high between B and A.
3. Fib extension
Levels are projected from point C using the A→B leg:
Level price = C ± (B − A) × ratio
Default "MAGIC" ratios: 0, 0.5, 0.618, 1.414, 1.618, 2, 2.272, 2.618 (all editable, each can be turned on/off).
4. Trade levels
- Entry = point C (level 0)
- Stop Loss = beyond point C or beyond point A, with an ATR(14) buffer
- TP1 / TP2 / TP3 = selectable fib levels (default 0.618 / 1.618 / 2.618)
Labels are updated with ✓ when a TP is reached and ✗ when the SL is hit.
CLEAN CHART
Only the latest setup is drawn by default ("Setups kept on chart" = 1). Older setups are removed from the chart but are still tracked in the background, so the statistics stay complete.
WIN / LOSS DASHBOARD
Shows Buy, Sell and Total columns:
- Closed trades, Wins, Losses, Win rate
- How many trades reached TP1, TP2 and TP3
- Currently open trades
Rules: a trade that reaches TP1 counts as a win (even if SL is hit afterwards). A trade that hits SL before TP1 counts as a loss. A trade closes at SL or TP3. If SL and a TP are touched in the same candle, SL is assumed first (conservative).
ALERTS
- New bullish / bearish setup (with Entry, SL, TP1–TP3 in the message)
- TP1, TP2, TP3 hit
- SL hit
SETTINGS
Pivot lengths, bull/bear filter, fib levels, TP levels, SL mode and ATR buffer, colours, background fill, level values/prices, dashboard position, and optional markers for past signals.
IMPORTANT NOTES
- A setup is confirmed only after point C is confirmed as a pivot (after "Pivot right bars" candles). By then price may have moved away from point C, so the dashboard statistics assume an entry at C and may look better than real-time trading results.
- Statistics are based on the chart history loaded in TradingView and change with symbol and timeframe.
- This indicator is a tool for analysis and education. It is not financial advice and past results do not guarantee future performance. Always use proper risk management.
TRADE MANAGEMENT
Once TP1 is reached, move the Stop Loss to Cost to Cost (breakeven at the entry price). This protects the trade, and the remaining position can run towards TP2 and TP3 risk-free.
HOW IT WORKS
1. Swing detection
The script uses pivot highs and lows (adjustable left/right bars) to build an alternating chain of swing points.
2. A → B → C pattern
- Bullish: A = swing low, B = swing high, C = higher low between A and B.
- Bearish: A = swing high, B = swing low, C = lower high between B and A.
3. Fib extension
Levels are projected from point C using the A→B leg:
Level price = C ± (B − A) × ratio
Default "MAGIC" ratios: 0, 0.5, 0.618, 1.414, 1.618, 2, 2.272, 2.618 (all editable, each can be turned on/off).
4. Trade levels
- Entry = point C (level 0)
- Stop Loss = beyond point C or beyond point A, with an ATR(14) buffer
- TP1 / TP2 / TP3 = selectable fib levels (default 0.618 / 1.618 / 2.618)
Labels are updated with ✓ when a TP is reached and ✗ when the SL is hit.
CLEAN CHART
Only the latest setup is drawn by default ("Setups kept on chart" = 1). Older setups are removed from the chart but are still tracked in the background, so the statistics stay complete.
WIN / LOSS DASHBOARD
Shows Buy, Sell and Total columns:
- Closed trades, Wins, Losses, Win rate
- How many trades reached TP1, TP2 and TP3
- Currently open trades
Rules: a trade that reaches TP1 counts as a win (even if SL is hit afterwards). A trade that hits SL before TP1 counts as a loss. A trade closes at SL or TP3. If SL and a TP are touched in the same candle, SL is assumed first (conservative).
ALERTS
- New bullish / bearish setup (with Entry, SL, TP1–TP3 in the message)
- TP1, TP2, TP3 hit
- SL hit
SETTINGS
Pivot lengths, bull/bear filter, fib levels, TP levels, SL mode and ATR buffer, colours, background fill, level values/prices, dashboard position, and optional markers for past signals.
IMPORTANT NOTES
- A setup is confirmed only after point C is confirmed as a pivot (after "Pivot right bars" candles). By then price may have moved away from point C, so the dashboard statistics assume an entry at C and may look better than real-time trading results.
- Statistics are based on the chart history loaded in TradingView and change with symbol and timeframe.
- This indicator is a tool for analysis and education. It is not financial advice and past results do not guarantee future performance. Always use proper risk management.
TRADE MANAGEMENT
Once TP1 is reached, move the Stop Loss to Cost to Cost (breakeven at the entry price). This protects the trade, and the remaining position can run towards TP2 and TP3 risk-free.
오픈 소스 스크립트
트레이딩뷰의 진정한 정신에 따라, 이 스크립트의 작성자는 이를 오픈소스로 공개하여 트레이더들이 기능을 검토하고 검증할 수 있도록 했습니다. 작성자에게 찬사를 보냅니다! 이 코드는 무료로 사용할 수 있지만, 코드를 재게시하는 경우 하우스 룰이 적용된다는 점을 기억하세요.

면책사항
해당 정보와 게시물은 금융, 투자, 트레이딩 또는 기타 유형의 조언이나 권장 사항으로 간주되지 않으며, 트레이딩뷰에서 제공하거나 보증하는 것이 아닙니다. 자세한 내용은 이용 약관을 참조하세요.
오픈 소스 스크립트
트레이딩뷰의 진정한 정신에 따라, 이 스크립트의 작성자는 이를 오픈소스로 공개하여 트레이더들이 기능을 검토하고 검증할 수 있도록 했습니다. 작성자에게 찬사를 보냅니다! 이 코드는 무료로 사용할 수 있지만, 코드를 재게시하는 경우 하우스 룰이 적용된다는 점을 기억하세요.
면책사항
해당 정보와 게시물은 금융, 투자, 트레이딩 또는 기타 유형의 조언이나 권장 사항으로 간주되지 않으며, 트레이딩뷰에서 제공하거나 보증하는 것이 아닙니다. 자세한 내용은 이용 약관을 참조하세요.