OPEN-SOURCE SCRIPT
Volume Profile - Accurate
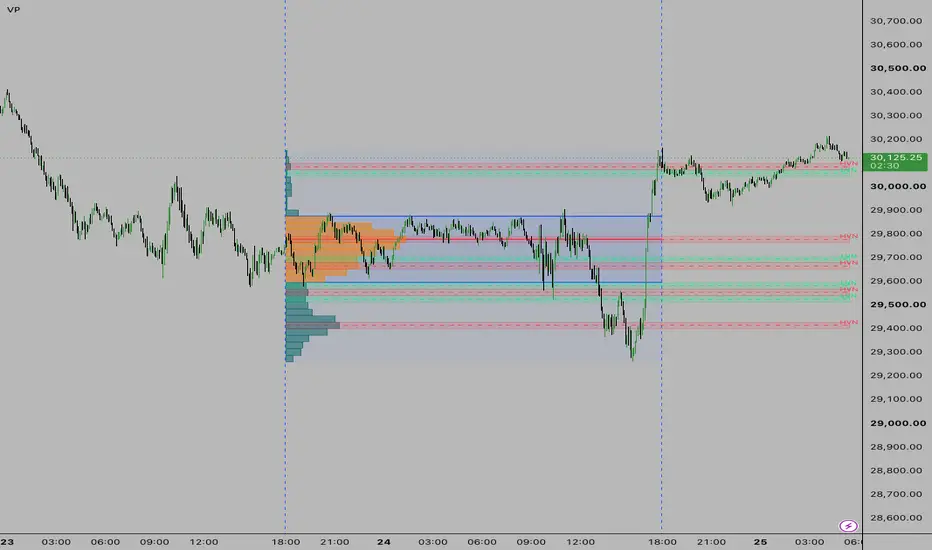
Core Architecture
1. Lower-Timeframe Precision Engine Traditional volume profiles on TradingView can be inaccurate because they guess the volume distribution within a daily candle. This script actually pulls raw data from a lower Source TF (default 5-minute) using request.security_lower_tf and mathematically reconstructs the exact volume traded at every single price tick for the entire day.
2. The Histogram (The Profile itself) It divides the entire price range of the period into a set number of horizontal rows (default 24). It then sorts the lower timeframe volume into these rows, painting a histogram (horizontal bars) on the side of the chart.
Key Trading Features
1. Point of Control (POC) The script mathematically isolates the single row with the absolute highest traded volume for the period.
Action: It projects a solid red line across the chart at this exact price level. The POC acts as the ultimate "fair value" price where buyers and sellers agreed the most, making it a massive magnet for future price action and a strong support/resistance level.
2. Value Area (VA) It calculates the core range where the majority of the trading took place (default is 68% of all volume, representing one standard deviation).
Action: It plots the Value Area High (VAH) and Value Area Low (VAL) as blue lines, and dynamically fills the background between them. Trading outside the Value Area represents an imbalance, while trading inside it represents balance.
3. Advanced Node Detection (HVN & LVN) This is where the script shines. It doesn't just plot the profile; it uses an algorithm to scan the shape of the profile and identify specific structural anomalies:
HVN (High Volume Nodes): Peaks in the profile (other than the POC). The script automatically draws red dashed lines and boxes at these levels. They act as localized support/resistance ledges.
LVN (Low Volume Nodes): Valleys or "gaps" in the profile where price moved so fast that almost zero volume was traded.
LVN Areas: The script goes a step further and intelligently groups adjacent LVNs together to create an "LVN Area" box (default Lime Green). Because there is no historical volume here to stop the price, if price enters an LVN Area, it will usually slice right through it like a hot knife
through butter.
Visual Control
It uses Pine Script's array-based object management (array<box>, array<line>) to dynamically clean up and redraw the profile flawlessly on every tick. You have full control in the settings over where the profile draws (Left/Right), its width, the color of the Value area vs outside the Value area, and toggles for every single specific node.
1. Lower-Timeframe Precision Engine Traditional volume profiles on TradingView can be inaccurate because they guess the volume distribution within a daily candle. This script actually pulls raw data from a lower Source TF (default 5-minute) using request.security_lower_tf and mathematically reconstructs the exact volume traded at every single price tick for the entire day.
2. The Histogram (The Profile itself) It divides the entire price range of the period into a set number of horizontal rows (default 24). It then sorts the lower timeframe volume into these rows, painting a histogram (horizontal bars) on the side of the chart.
Key Trading Features
1. Point of Control (POC) The script mathematically isolates the single row with the absolute highest traded volume for the period.
Action: It projects a solid red line across the chart at this exact price level. The POC acts as the ultimate "fair value" price where buyers and sellers agreed the most, making it a massive magnet for future price action and a strong support/resistance level.
2. Value Area (VA) It calculates the core range where the majority of the trading took place (default is 68% of all volume, representing one standard deviation).
Action: It plots the Value Area High (VAH) and Value Area Low (VAL) as blue lines, and dynamically fills the background between them. Trading outside the Value Area represents an imbalance, while trading inside it represents balance.
3. Advanced Node Detection (HVN & LVN) This is where the script shines. It doesn't just plot the profile; it uses an algorithm to scan the shape of the profile and identify specific structural anomalies:
HVN (High Volume Nodes): Peaks in the profile (other than the POC). The script automatically draws red dashed lines and boxes at these levels. They act as localized support/resistance ledges.
LVN (Low Volume Nodes): Valleys or "gaps" in the profile where price moved so fast that almost zero volume was traded.
LVN Areas: The script goes a step further and intelligently groups adjacent LVNs together to create an "LVN Area" box (default Lime Green). Because there is no historical volume here to stop the price, if price enters an LVN Area, it will usually slice right through it like a hot knife
through butter.
Visual Control
It uses Pine Script's array-based object management (array<box>, array<line>) to dynamically clean up and redraw the profile flawlessly on every tick. You have full control in the settings over where the profile draws (Left/Right), its width, the color of the Value area vs outside the Value area, and toggles for every single specific node.
오픈 소스 스크립트
트레이딩뷰의 진정한 정신에 따라, 이 스크립트의 작성자는 이를 오픈소스로 공개하여 트레이더들이 기능을 검토하고 검증할 수 있도록 했습니다. 작성자에게 찬사를 보냅니다! 이 코드는 무료로 사용할 수 있지만, 코드를 재게시하는 경우 하우스 룰이 적용된다는 점을 기억하세요.

면책사항
해당 정보와 게시물은 금융, 투자, 트레이딩 또는 기타 유형의 조언이나 권장 사항으로 간주되지 않으며, 트레이딩뷰에서 제공하거나 보증하는 것이 아닙니다. 자세한 내용은 이용 약관을 참조하세요.
오픈 소스 스크립트
트레이딩뷰의 진정한 정신에 따라, 이 스크립트의 작성자는 이를 오픈소스로 공개하여 트레이더들이 기능을 검토하고 검증할 수 있도록 했습니다. 작성자에게 찬사를 보냅니다! 이 코드는 무료로 사용할 수 있지만, 코드를 재게시하는 경우 하우스 룰이 적용된다는 점을 기억하세요.
면책사항
해당 정보와 게시물은 금융, 투자, 트레이딩 또는 기타 유형의 조언이나 권장 사항으로 간주되지 않으며, 트레이딩뷰에서 제공하거나 보증하는 것이 아닙니다. 자세한 내용은 이용 약관을 참조하세요.