OPEN-SOURCE SCRIPT
Support & Resistance Levels
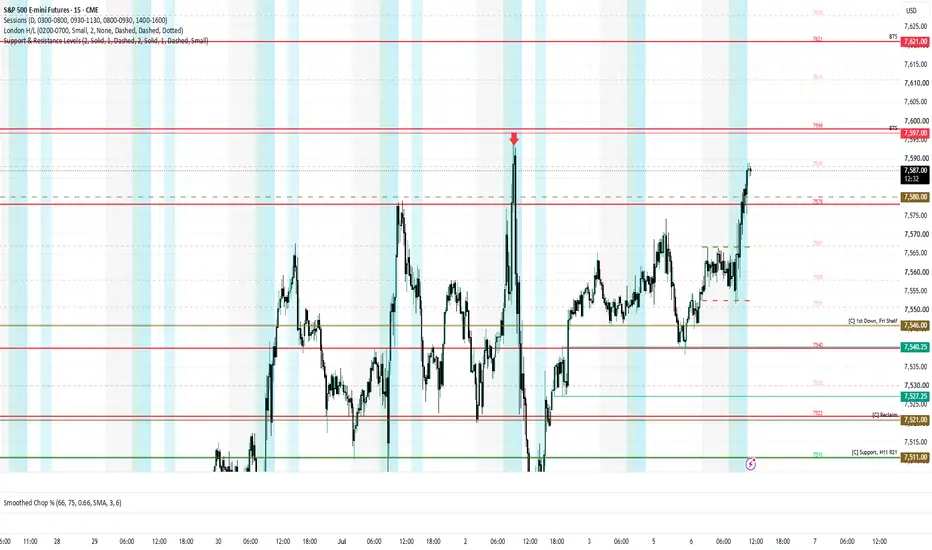
Support and resistance levels plotter created specifically for copying Adam Mancini's Newsletter levels onto your chart in one copy and paste (one for the supports and one for the resistances).
You can format the style of the support and resistance lines independently as well as the major and minor lines. You can also turn off the minor lines.
How to use:
1. copy the entire block of text for the support levels from Adam's newsletter, starting with the first support level e.g.
"
7511 (major), 7501, 7492 (major), 7482 (major), 7473, 7459, 7454 (major), 7439, 7421 (major), 7409, 7399 (major), 7390, 7382, 7374, 7369 (major), 7364, 7358 (major), 7351, 7346 (Major), 7341, 7337 (major), 7331, 7325, 7311 (major), 7303, 7294, 7288 (major), 7274, 7271 (major), 7266, 7262 (major), 7257, 7252 (major), 7244 (major), 7236, 7228, 7223 (major), 7211 (major), 7197, 7191 (major).
"
2. Open the indicator setting and paste the entire string into the input window for "supports".
3. Repeat for resistance and voila!
There is a debug table you chose to add that shows the number of support and resistance levels being parsed.
If the levels don't scroll correctly, right click on the y-axis and ensure "scale price chart only" is unchecked.
You can format the style of the support and resistance lines independently as well as the major and minor lines. You can also turn off the minor lines.
How to use:
1. copy the entire block of text for the support levels from Adam's newsletter, starting with the first support level e.g.
"
7511 (major), 7501, 7492 (major), 7482 (major), 7473, 7459, 7454 (major), 7439, 7421 (major), 7409, 7399 (major), 7390, 7382, 7374, 7369 (major), 7364, 7358 (major), 7351, 7346 (Major), 7341, 7337 (major), 7331, 7325, 7311 (major), 7303, 7294, 7288 (major), 7274, 7271 (major), 7266, 7262 (major), 7257, 7252 (major), 7244 (major), 7236, 7228, 7223 (major), 7211 (major), 7197, 7191 (major).
"
2. Open the indicator setting and paste the entire string into the input window for "supports".
3. Repeat for resistance and voila!
There is a debug table you chose to add that shows the number of support and resistance levels being parsed.
If the levels don't scroll correctly, right click on the y-axis and ensure "scale price chart only" is unchecked.
오픈 소스 스크립트
트레이딩뷰의 진정한 정신에 따라, 이 스크립트의 작성자는 이를 오픈소스로 공개하여 트레이더들이 기능을 검토하고 검증할 수 있도록 했습니다. 작성자에게 찬사를 보냅니다! 이 코드는 무료로 사용할 수 있지만, 코드를 재게시하는 경우 하우스 룰이 적용된다는 점을 기억하세요.

면책사항
해당 정보와 게시물은 금융, 투자, 트레이딩 또는 기타 유형의 조언이나 권장 사항으로 간주되지 않으며, 트레이딩뷰에서 제공하거나 보증하는 것이 아닙니다. 자세한 내용은 이용 약관을 참조하세요.
오픈 소스 스크립트
트레이딩뷰의 진정한 정신에 따라, 이 스크립트의 작성자는 이를 오픈소스로 공개하여 트레이더들이 기능을 검토하고 검증할 수 있도록 했습니다. 작성자에게 찬사를 보냅니다! 이 코드는 무료로 사용할 수 있지만, 코드를 재게시하는 경우 하우스 룰이 적용된다는 점을 기억하세요.
면책사항
해당 정보와 게시물은 금융, 투자, 트레이딩 또는 기타 유형의 조언이나 권장 사항으로 간주되지 않으며, 트레이딩뷰에서 제공하거나 보증하는 것이 아닙니다. 자세한 내용은 이용 약관을 참조하세요.