OPEN-SOURCE SCRIPT
업데이트됨 Core Structure Break [UkutaLabs]
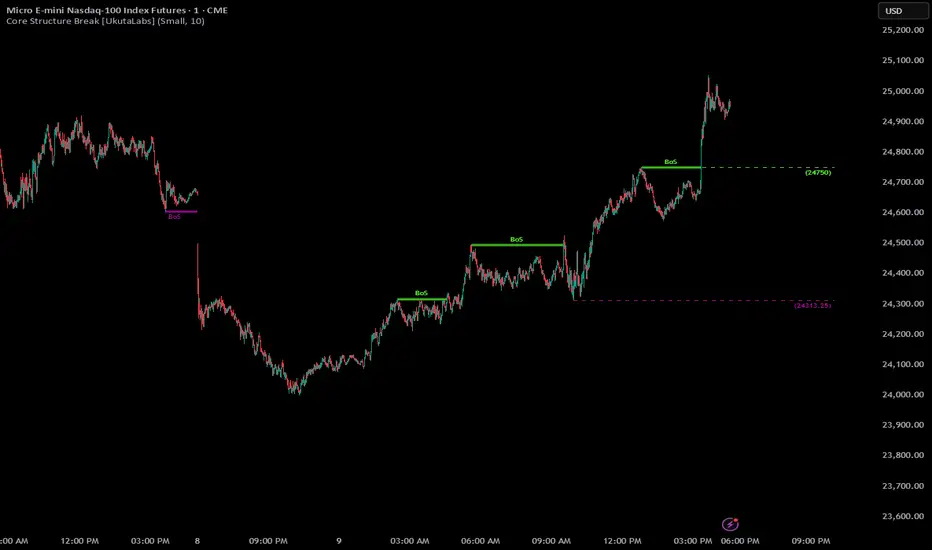
█ OVERVIEW
Core Structure Break is designed to automatically detect Breaks of Structure (BoS) in price action, helping traders quickly identify when the market transitions from one structural phase to another.
A Break of Structure occurs when price moves beyond a previous swing high or swing low, signaling that the current trend may be continuing or shifting. These moments are often where momentum accelerates as liquidity is taken and market participants reposition.
This indicator removes the need to manually track swing points by automatically identifying key structure levels and highlighting when they are broken.
By clearly marking these structural events, traders can better understand trend continuation, potential reversals, and areas where liquidity has likely been taken.
█ FEATURES
Automatic Structure Detection
Identifies important swing highs and lows to define the current market structure.
Break of Structure Signals (BoS)
Highlights when price breaks a previously established structural level.
Bullish & Bearish Structure Breaks
Clearly distinguishes between bullish and bearish structural shifts.
Clean Chart Visualization
Designed to provide clear structural insights without cluttering your chart.
Works Across All Markets & Timeframes
Suitable for Forex, Crypto, Stocks, and Futures on any timeframe.
█ HOW TO USE
Trend Confirmation
A bullish break of structure suggests buyers are in control and the trend may continue upward.
A bearish break of structure suggests sellers are dominating the market.
Continuation Trades
Traders often use BOS signals to confirm that a trend remains intact before entering pullback trades.
Liquidity & Momentum Awareness
Structure breaks frequently occur when liquidity above highs or below lows is taken. This can lead to rapid price movement.
Combine With Other Tools
For best results, use structural breaks alongside other concepts such as:
█ WHY MARKET STRUCTURE MATTERS
Markets move in cycles of accumulation, expansion, retracement, and continuation.
Breaks of structure are often the first sign that the next phase has begun.
By identifying these key moments automatically, Core Structure Break helps traders stay aligned with the underlying market structure instead of reacting emotionally to every price movement.
Core Structure Break is designed to automatically detect Breaks of Structure (BoS) in price action, helping traders quickly identify when the market transitions from one structural phase to another.
A Break of Structure occurs when price moves beyond a previous swing high or swing low, signaling that the current trend may be continuing or shifting. These moments are often where momentum accelerates as liquidity is taken and market participants reposition.
This indicator removes the need to manually track swing points by automatically identifying key structure levels and highlighting when they are broken.
By clearly marking these structural events, traders can better understand trend continuation, potential reversals, and areas where liquidity has likely been taken.
█ FEATURES
Automatic Structure Detection
Identifies important swing highs and lows to define the current market structure.
Break of Structure Signals (BoS)
Highlights when price breaks a previously established structural level.
Bullish & Bearish Structure Breaks
Clearly distinguishes between bullish and bearish structural shifts.
Clean Chart Visualization
Designed to provide clear structural insights without cluttering your chart.
Works Across All Markets & Timeframes
Suitable for Forex, Crypto, Stocks, and Futures on any timeframe.
█ HOW TO USE
Trend Confirmation
A bullish break of structure suggests buyers are in control and the trend may continue upward.
A bearish break of structure suggests sellers are dominating the market.
Continuation Trades
Traders often use BOS signals to confirm that a trend remains intact before entering pullback trades.
Liquidity & Momentum Awareness
Structure breaks frequently occur when liquidity above highs or below lows is taken. This can lead to rapid price movement.
Combine With Other Tools
For best results, use structural breaks alongside other concepts such as:
- Support & Resistance
- Liquidity Sweeps
- Order Blocks
- Fair Value Gaps
- Trend Indicators
█ WHY MARKET STRUCTURE MATTERS
Markets move in cycles of accumulation, expansion, retracement, and continuation.
Breaks of structure are often the first sign that the next phase has begun.
By identifying these key moments automatically, Core Structure Break helps traders stay aligned with the underlying market structure instead of reacting emotionally to every price movement.
릴리즈 노트
Add 'Max Display' to allow customization of number of BoS to display.오픈 소스 스크립트
트레이딩뷰의 진정한 정신에 따라, 이 스크립트의 작성자는 이를 오픈소스로 공개하여 트레이더들이 기능을 검토하고 검증할 수 있도록 했습니다. 작성자에게 찬사를 보냅니다! 이 코드는 무료로 사용할 수 있지만, 코드를 재게시하는 경우 하우스 룰이 적용된다는 점을 기억하세요.

면책사항
해당 정보와 게시물은 금융, 투자, 트레이딩 또는 기타 유형의 조언이나 권장 사항으로 간주되지 않으며, 트레이딩뷰에서 제공하거나 보증하는 것이 아닙니다. 자세한 내용은 이용 약관을 참조하세요.
오픈 소스 스크립트
트레이딩뷰의 진정한 정신에 따라, 이 스크립트의 작성자는 이를 오픈소스로 공개하여 트레이더들이 기능을 검토하고 검증할 수 있도록 했습니다. 작성자에게 찬사를 보냅니다! 이 코드는 무료로 사용할 수 있지만, 코드를 재게시하는 경우 하우스 룰이 적용된다는 점을 기억하세요.
면책사항
해당 정보와 게시물은 금융, 투자, 트레이딩 또는 기타 유형의 조언이나 권장 사항으로 간주되지 않으며, 트레이딩뷰에서 제공하거나 보증하는 것이 아닙니다. 자세한 내용은 이용 약관을 참조하세요.