Daily % Change Table
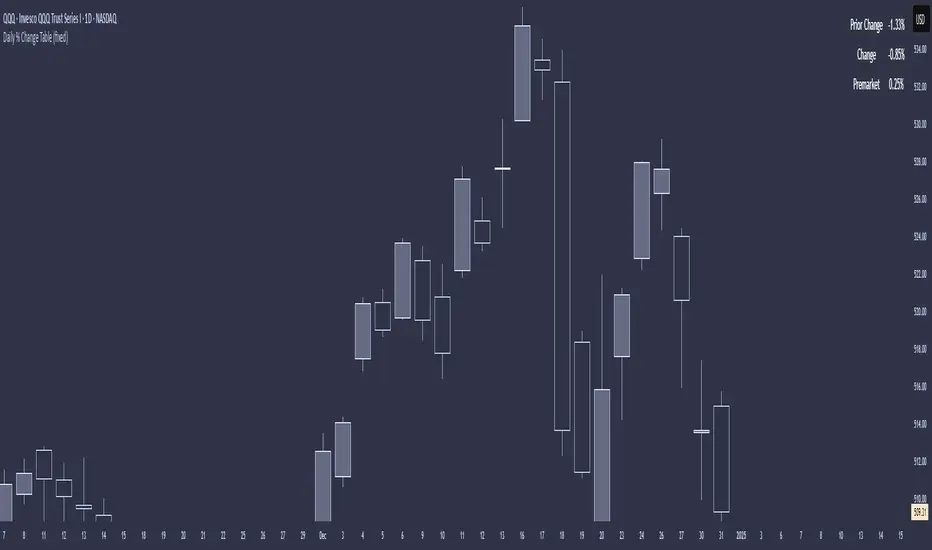
Daily % Change Table — Indicator Summary
This indicator provides a compact performance summary for daily candles, designed for backtesting and daily-session analysis. It displays a table in the top-right corner of the chart showing three key percentage-change statistics based on the current candle:
1. Prior Change
Percentage move from the close two days ago to the prior day’s close.
Useful for understanding momentum and context heading into the current session.
2. Change
Percentage move from the prior day's close to the current candle’s close.
Shows today’s full-session change.
3. Premarket
Percentage move from the prior day's close to the current day’s open.
Helps quantify overnight sentiment and gap activity.
Features
Clean, unobtrusive table display
Automatically updates on the most recent bar
Designed for use on Daily timeframe
Useful for gap analysis, backtesting, and volatility/momentum studies

면책사항
해당 정보와 게시물은 금융, 투자, 트레이딩 또는 기타 유형의 조언이나 권장 사항으로 간주되지 않으며, 트레이딩뷰에서 제공하거나 보증하는 것이 아닙니다. 자세한 내용은 이용 약관을 참조하세요.
면책사항
해당 정보와 게시물은 금융, 투자, 트레이딩 또는 기타 유형의 조언이나 권장 사항으로 간주되지 않으며, 트레이딩뷰에서 제공하거나 보증하는 것이 아닙니다. 자세한 내용은 이용 약관을 참조하세요.