OPEN-SOURCE SCRIPT
NL LBR 3-10 Oscillator
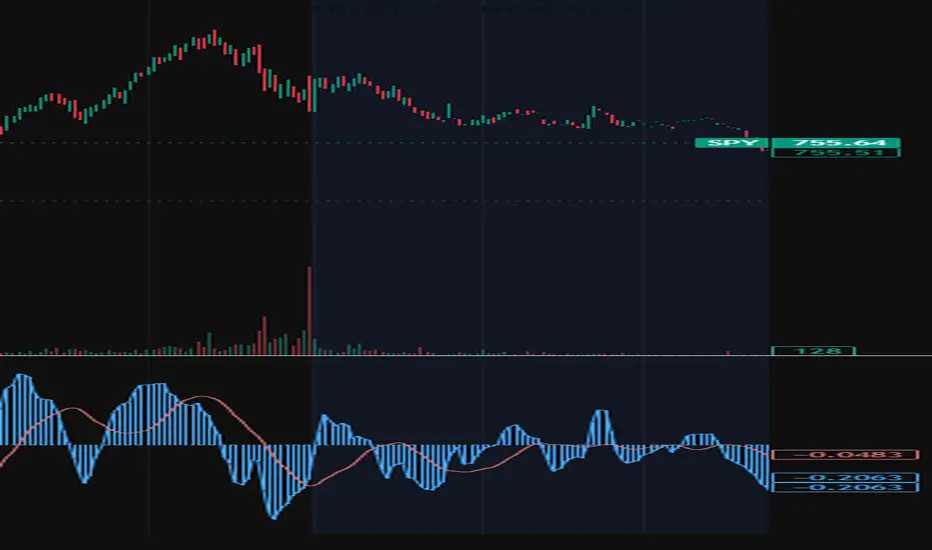
LBR 3-10 Oscillator with Divergence & Convergence
The LBR 3-10 Oscillator is a momentum indicator developed by Linda Bradford Raschke. It measures the difference between a 3-period and 10-period moving average, smoothed by a 16-period signal line — functionally similar to MACD but tuned for shorter-term momentum cycles. It is particularly effective for identifying trend direction, pullback entries, and momentum exhaustion.
Oscillator
Fast MA (default 3) minus Slow MA (default 10), plotted as both a line and histogram
Signal line smoothing (default 16) displayed as an overlay
Optional volatility normalization via ATR to compare momentum across instruments and timeframes
Optional standard deviation bands to identify statistically extended readings
Choice of SMA or EMA for both the oscillator and signal line
Divergence & Convergence
Lines are drawn directly on the oscillator pane connecting MACD pivot points — no cluttered price chart markings.
🟢 Bullish Divergence (solid green) — Price makes a lower low while the oscillator makes a higher low. Classic reversal signal indicating selling momentum is fading.
🔴 Bearish Divergence (solid red) — Price makes a higher high while the oscillator makes a lower high. Momentum is fading into the new high, warning of a potential reversal.
🟢 Bullish Convergence (dashed green) — Price makes a higher low while the oscillator makes a lower low. Hidden bullish signal confirming trend continuation to the upside.
🔴 Bearish Convergence (dashed red) — Price makes a lower high while the oscillator makes a higher high. Hidden bearish signal confirming trend continuation to the downside.
Each divergence and convergence type can be toggled on or off independently. Pivot lookback is fully adjustable to control signal sensitivity.
Alerts
All signals support TradingView alerts:
Trend change up / down
Pullback in uptrend / downtrend
First cross in uptrend / downtrend
Bullish / Bearish Divergence
Bullish / Bearish Convergence
The LBR 3-10 Oscillator is a momentum indicator developed by Linda Bradford Raschke. It measures the difference between a 3-period and 10-period moving average, smoothed by a 16-period signal line — functionally similar to MACD but tuned for shorter-term momentum cycles. It is particularly effective for identifying trend direction, pullback entries, and momentum exhaustion.
Oscillator
Fast MA (default 3) minus Slow MA (default 10), plotted as both a line and histogram
Signal line smoothing (default 16) displayed as an overlay
Optional volatility normalization via ATR to compare momentum across instruments and timeframes
Optional standard deviation bands to identify statistically extended readings
Choice of SMA or EMA for both the oscillator and signal line
Divergence & Convergence
Lines are drawn directly on the oscillator pane connecting MACD pivot points — no cluttered price chart markings.
🟢 Bullish Divergence (solid green) — Price makes a lower low while the oscillator makes a higher low. Classic reversal signal indicating selling momentum is fading.
🔴 Bearish Divergence (solid red) — Price makes a higher high while the oscillator makes a lower high. Momentum is fading into the new high, warning of a potential reversal.
🟢 Bullish Convergence (dashed green) — Price makes a higher low while the oscillator makes a lower low. Hidden bullish signal confirming trend continuation to the upside.
🔴 Bearish Convergence (dashed red) — Price makes a lower high while the oscillator makes a higher high. Hidden bearish signal confirming trend continuation to the downside.
Each divergence and convergence type can be toggled on or off independently. Pivot lookback is fully adjustable to control signal sensitivity.
Alerts
All signals support TradingView alerts:
Trend change up / down
Pullback in uptrend / downtrend
First cross in uptrend / downtrend
Bullish / Bearish Divergence
Bullish / Bearish Convergence
오픈 소스 스크립트
트레이딩뷰의 진정한 정신에 따라, 이 스크립트의 작성자는 이를 오픈소스로 공개하여 트레이더들이 기능을 검토하고 검증할 수 있도록 했습니다. 작성자에게 찬사를 보냅니다! 이 코드는 무료로 사용할 수 있지만, 코드를 재게시하는 경우 하우스 룰이 적용된다는 점을 기억하세요.

면책사항
해당 정보와 게시물은 금융, 투자, 트레이딩 또는 기타 유형의 조언이나 권장 사항으로 간주되지 않으며, 트레이딩뷰에서 제공하거나 보증하는 것이 아닙니다. 자세한 내용은 이용 약관을 참조하세요.
오픈 소스 스크립트
트레이딩뷰의 진정한 정신에 따라, 이 스크립트의 작성자는 이를 오픈소스로 공개하여 트레이더들이 기능을 검토하고 검증할 수 있도록 했습니다. 작성자에게 찬사를 보냅니다! 이 코드는 무료로 사용할 수 있지만, 코드를 재게시하는 경우 하우스 룰이 적용된다는 점을 기억하세요.
면책사항
해당 정보와 게시물은 금융, 투자, 트레이딩 또는 기타 유형의 조언이나 권장 사항으로 간주되지 않으며, 트레이딩뷰에서 제공하거나 보증하는 것이 아닙니다. 자세한 내용은 이용 약관을 참조하세요.