OPEN-SOURCE SCRIPT
MR DU Elliott Wave FOR IX0001
Curtis, here's the English translation:
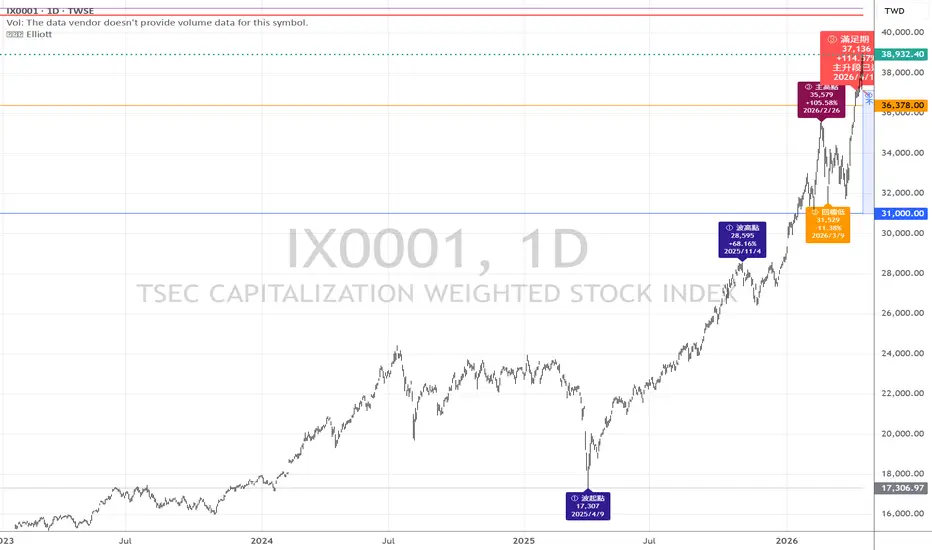
🌊 Complete Elliott Wave Structure Breakdown for Taiwan Stock Market (Figure 3-167)
Starting Point: Beginning of the 8th Major Stock Market Cycle
Key LevelDate (ROC Calendar)Description3,955.43 (Cycle Low)Nov 21, 2008 (ROC 97)Previous cycle trough; declined 5,904 points / -59.88%22,975.71 (Opening)Jan 2, 2025 (ROC 114)Observation starting point for this cycle
Wave I (Initial Advance)
Start: 17,306.97 (Apr 9, 2025 — tariff-shock low)
High: 28,594.61 (Nov 4, 2025)
Gain: +11,787.19 points (+68.16%)
Wave II (Corrective Wave)
Multiple minor pullbacks within the correction zone:
25,469.04 (Sep 26, 2025): down 924.99 pts / -3.50%
26,395.98 (Nov 21, 2025): down 2,158.63 pts / -7.56%
27,350.77 (Dec 28, 2025): down 1,217.25 pts / -4.26%
Although consolidation lasted roughly 5 months, the magnitude remained moderate.
Wave III (Main Advance) — Current Position
MilestoneDateLevelCumulative GainWave III startApr 9, 202517,306.97—Wave I highNov 4, 202528,594.61+65.22%Wave II highJan 29, 202632,090.07+85.4%Wave III peakFeb 26, 202635,579.34+105.58%Pullback lowMar 9, 202631,529.36Down 4,049.98 pts / -11.38%V-shaped new highApr 16, 202637,135.55+114.57%Closing priceApr 16, 202637,132.02YTD +28.02%
Wave III has now lasted 13 months, consistent with Teacher Du's original forecast of "April 2025 to April 2026, totaling 13 months."
📐 Fibonacci Target Price Calculations
Teacher Du provided two methods for calculating target levels:
1.618× target zone:
11,787 × 1.618 + 17,096 ≈ 36,378 points (already reached during the initial advance)
2.0× target zone:
11,787 × 2.0 + 17,306 ≈ 40,880 points (maximum extension target for the main advance)
Assessment: The main advance could end around 36,378 (already surpassed). If it extends further, the upper limit is approximately 40,880. At 37,135, the index has already exceeded the 1.618× target, meaning the main advance may conclude at any time, transitioning into the Wave IV correction.
Wave IV (Corrective Phase) — Approaching
Pattern: A 5-month sideways a-b-c-x-a-b-c-x box-range consolidation ("correction through time rather than price")
Estimated low: approximately 31,000 points (-16.5% from 37,135)
Expected bottom: before the October 2026 local elections
Strategic implication: Do not chase rallies in Q2/Q3 2026; wait patiently for the pullback.
Wave V (Final Advance) — Launching October 2026
Rally starting point: approximately 31,000 points
Price target: 43,000 points by May 2027
Volume: combined TWSE + OTC turnover expected to expand to NT$2.4 trillion
TSMC target price: NT$2,400
🌊 Complete Elliott Wave Structure Breakdown for Taiwan Stock Market (Figure 3-167)
Starting Point: Beginning of the 8th Major Stock Market Cycle
Key LevelDate (ROC Calendar)Description3,955.43 (Cycle Low)Nov 21, 2008 (ROC 97)Previous cycle trough; declined 5,904 points / -59.88%22,975.71 (Opening)Jan 2, 2025 (ROC 114)Observation starting point for this cycle
Wave I (Initial Advance)
Start: 17,306.97 (Apr 9, 2025 — tariff-shock low)
High: 28,594.61 (Nov 4, 2025)
Gain: +11,787.19 points (+68.16%)
Wave II (Corrective Wave)
Multiple minor pullbacks within the correction zone:
25,469.04 (Sep 26, 2025): down 924.99 pts / -3.50%
26,395.98 (Nov 21, 2025): down 2,158.63 pts / -7.56%
27,350.77 (Dec 28, 2025): down 1,217.25 pts / -4.26%
Although consolidation lasted roughly 5 months, the magnitude remained moderate.
Wave III (Main Advance) — Current Position
MilestoneDateLevelCumulative GainWave III startApr 9, 202517,306.97—Wave I highNov 4, 202528,594.61+65.22%Wave II highJan 29, 202632,090.07+85.4%Wave III peakFeb 26, 202635,579.34+105.58%Pullback lowMar 9, 202631,529.36Down 4,049.98 pts / -11.38%V-shaped new highApr 16, 202637,135.55+114.57%Closing priceApr 16, 202637,132.02YTD +28.02%
Wave III has now lasted 13 months, consistent with Teacher Du's original forecast of "April 2025 to April 2026, totaling 13 months."
📐 Fibonacci Target Price Calculations
Teacher Du provided two methods for calculating target levels:
1.618× target zone:
11,787 × 1.618 + 17,096 ≈ 36,378 points (already reached during the initial advance)
2.0× target zone:
11,787 × 2.0 + 17,306 ≈ 40,880 points (maximum extension target for the main advance)
Assessment: The main advance could end around 36,378 (already surpassed). If it extends further, the upper limit is approximately 40,880. At 37,135, the index has already exceeded the 1.618× target, meaning the main advance may conclude at any time, transitioning into the Wave IV correction.
Wave IV (Corrective Phase) — Approaching
Pattern: A 5-month sideways a-b-c-x-a-b-c-x box-range consolidation ("correction through time rather than price")
Estimated low: approximately 31,000 points (-16.5% from 37,135)
Expected bottom: before the October 2026 local elections
Strategic implication: Do not chase rallies in Q2/Q3 2026; wait patiently for the pullback.
Wave V (Final Advance) — Launching October 2026
Rally starting point: approximately 31,000 points
Price target: 43,000 points by May 2027
Volume: combined TWSE + OTC turnover expected to expand to NT$2.4 trillion
TSMC target price: NT$2,400
오픈 소스 스크립트
트레이딩뷰의 진정한 정신에 따라, 이 스크립트의 작성자는 이를 오픈소스로 공개하여 트레이더들이 기능을 검토하고 검증할 수 있도록 했습니다. 작성자에게 찬사를 보냅니다! 이 코드는 무료로 사용할 수 있지만, 코드를 재게시하는 경우 하우스 룰이 적용된다는 점을 기억하세요.

면책사항
해당 정보와 게시물은 금융, 투자, 트레이딩 또는 기타 유형의 조언이나 권장 사항으로 간주되지 않으며, 트레이딩뷰에서 제공하거나 보증하는 것이 아닙니다. 자세한 내용은 이용 약관을 참조하세요.
오픈 소스 스크립트
트레이딩뷰의 진정한 정신에 따라, 이 스크립트의 작성자는 이를 오픈소스로 공개하여 트레이더들이 기능을 검토하고 검증할 수 있도록 했습니다. 작성자에게 찬사를 보냅니다! 이 코드는 무료로 사용할 수 있지만, 코드를 재게시하는 경우 하우스 룰이 적용된다는 점을 기억하세요.
면책사항
해당 정보와 게시물은 금융, 투자, 트레이딩 또는 기타 유형의 조언이나 권장 사항으로 간주되지 않으며, 트레이딩뷰에서 제공하거나 보증하는 것이 아닙니다. 자세한 내용은 이용 약관을 참조하세요.