OPEN-SOURCE SCRIPT
Advanced Multi-RSI Momentum System
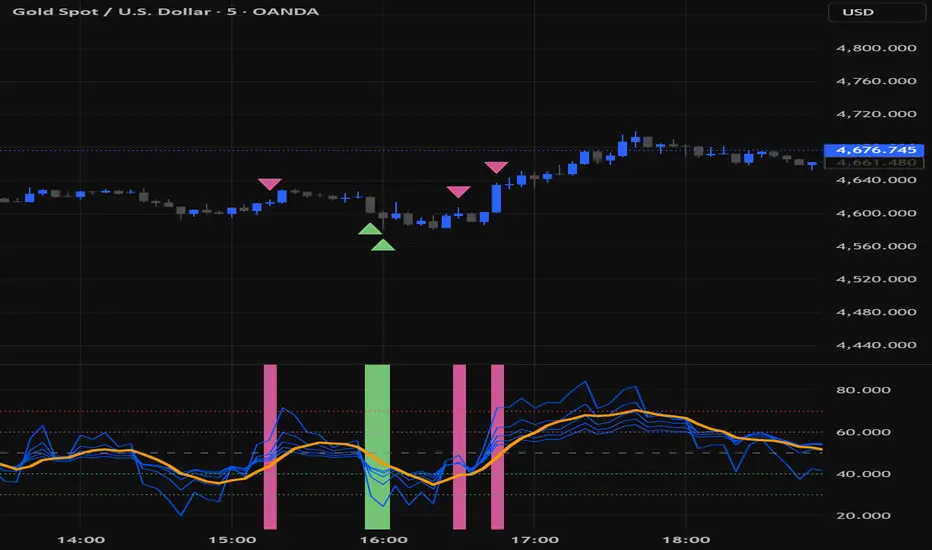
Advanced Multi-RSI Momentum System
This indicator is an enhanced version of multi-timeframe RSI analysis that combines five different RSI periods (7, 14, 21, 28, 35) with a Zero-Lag EMA to create a more responsive and reliable momentum oscillator.
What makes it different:
- Uses a weighted combination of multiple RSI lengths to reduce false signals common in single RSI indicators.
- Zero-Lag smoothing on the average RSI for faster reaction to momentum shifts.
- Intelligent color-coded background system that clearly shows:
• Early momentum signals
• Confirmation signals
• Momentum fading zones
• Consolidation phases (potential breakout setups)
- Clean triangle markers placed directly on the price chart for quick visual reference of buy and sell zones.
How it works:
The script calculates five RSIs with different sensitivities, takes their average, applies Zero-Lag EMA, and then uses specific crossover logic between the RSIs to detect shifts in momentum strength. Consolidation is detected by analyzing both price range and RSI range simultaneously.
Best used on 1H and 4H timeframes for swing and intraday trading.
All colors are fully customizable.
This is not just another RSI indicator — it's a complete momentum analysis system designed to help traders spot high-probability entries, exits, and consolidation breakouts with greater clarity.
Haschemi
This indicator is an enhanced version of multi-timeframe RSI analysis that combines five different RSI periods (7, 14, 21, 28, 35) with a Zero-Lag EMA to create a more responsive and reliable momentum oscillator.
What makes it different:
- Uses a weighted combination of multiple RSI lengths to reduce false signals common in single RSI indicators.
- Zero-Lag smoothing on the average RSI for faster reaction to momentum shifts.
- Intelligent color-coded background system that clearly shows:
• Early momentum signals
• Confirmation signals
• Momentum fading zones
• Consolidation phases (potential breakout setups)
- Clean triangle markers placed directly on the price chart for quick visual reference of buy and sell zones.
How it works:
The script calculates five RSIs with different sensitivities, takes their average, applies Zero-Lag EMA, and then uses specific crossover logic between the RSIs to detect shifts in momentum strength. Consolidation is detected by analyzing both price range and RSI range simultaneously.
Best used on 1H and 4H timeframes for swing and intraday trading.
All colors are fully customizable.
This is not just another RSI indicator — it's a complete momentum analysis system designed to help traders spot high-probability entries, exits, and consolidation breakouts with greater clarity.
Haschemi
오픈 소스 스크립트
트레이딩뷰의 진정한 정신에 따라, 이 스크립트의 작성자는 이를 오픈소스로 공개하여 트레이더들이 기능을 검토하고 검증할 수 있도록 했습니다. 작성자에게 찬사를 보냅니다! 이 코드는 무료로 사용할 수 있지만, 코드를 재게시하는 경우 하우스 룰이 적용된다는 점을 기억하세요.

면책사항
해당 정보와 게시물은 금융, 투자, 트레이딩 또는 기타 유형의 조언이나 권장 사항으로 간주되지 않으며, 트레이딩뷰에서 제공하거나 보증하는 것이 아닙니다. 자세한 내용은 이용 약관을 참조하세요.
오픈 소스 스크립트
트레이딩뷰의 진정한 정신에 따라, 이 스크립트의 작성자는 이를 오픈소스로 공개하여 트레이더들이 기능을 검토하고 검증할 수 있도록 했습니다. 작성자에게 찬사를 보냅니다! 이 코드는 무료로 사용할 수 있지만, 코드를 재게시하는 경우 하우스 룰이 적용된다는 점을 기억하세요.
면책사항
해당 정보와 게시물은 금융, 투자, 트레이딩 또는 기타 유형의 조언이나 권장 사항으로 간주되지 않으며, 트레이딩뷰에서 제공하거나 보증하는 것이 아닙니다. 자세한 내용은 이용 약관을 참조하세요.