OPEN-SOURCE SCRIPT
업데이트됨 IC KEY LEVELS & ICE
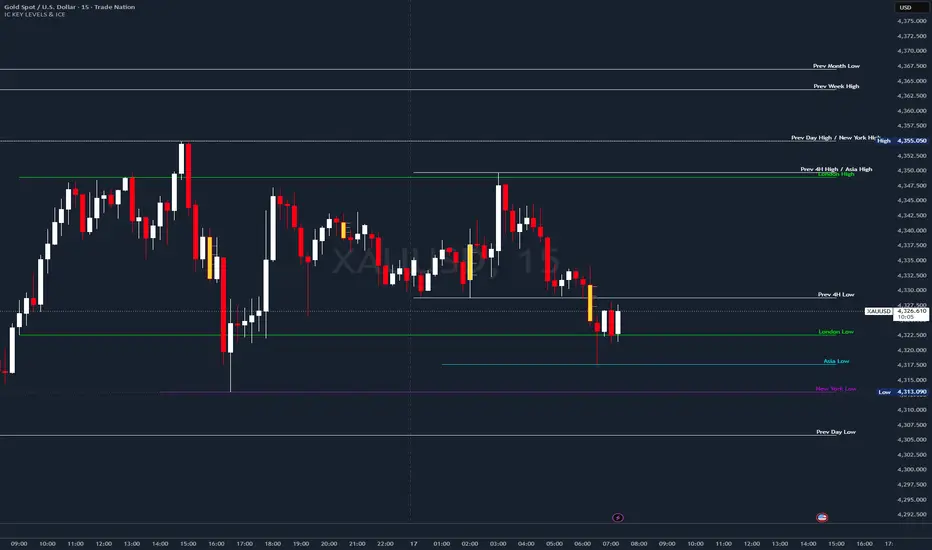
This is the IC Key Levels indicator — a multi-timeframe price level plotting tool built around the concept that key opens, highs, lows, and midpoints from higher timeframes act as significant support/resistance levels on lower timeframe charts.
What it plots
It draws horizontal lines with labels for the following levels, each toggleable independently:
4H — Previous 4H open, high, low, and midpoint
Daily — Current day's open, previous day's high, low, and midpoint
Monday Range — Monday's high, low, and midpoint (resets each week)
Weekly — Current week's open, previous week's high, low, and midpoint
Monthly — Current month's open, previous month's high, low, and midpoint
Quarterly — Current quarter's open, previous quarter's high, low, and midpoint
Yearly — Current year's open, current year's high, low, and midpoint
FX Sessions — London, New York, and Asia session highs, lows, and opens (tracked in each city's local timezone)
Key features
Merge Levels — When two or more levels share the exact same price, their labels are combined into one (e.g. "WO / MO"), preventing label clutter at confluences.
Display Style — Lines can be drawn from where the period opened ("Standard") or anchored to a fixed distance from the right edge of the chart ("Right Anchored"), useful for keeping levels visible regardless of how far you've scrolled.
Global Coloring — A single master color can override all individual timeframe colors at once.
Shorthand Labels — Each group can be switched to abbreviated text (e.g. "PWH" instead of "Prev Week High") to reduce chart noise.
Line customisation — Width (Small/Medium/Large), style (Solid/Dashed/Dotted), and label size are all configurable globally.
The philosophy behind it
This is rooted in ICT (Inner Circle Trader) concepts — hence "IC" in the name. The idea is that institutional order flow tends to react at these periodic open/high/low prices because large participants reference the same levels. The Monday Range in particular is a key ICT concept, as Monday's price action is often considered a "draw" that the rest of the week either sweeps or respects. Session ranges (London, NY, Asia) are similarly used to identify where liquidity was taken and where price may return.
ICE CANDLE LOGIC INCLUDED
What it plots
It draws horizontal lines with labels for the following levels, each toggleable independently:
4H — Previous 4H open, high, low, and midpoint
Daily — Current day's open, previous day's high, low, and midpoint
Monday Range — Monday's high, low, and midpoint (resets each week)
Weekly — Current week's open, previous week's high, low, and midpoint
Monthly — Current month's open, previous month's high, low, and midpoint
Quarterly — Current quarter's open, previous quarter's high, low, and midpoint
Yearly — Current year's open, current year's high, low, and midpoint
FX Sessions — London, New York, and Asia session highs, lows, and opens (tracked in each city's local timezone)
Key features
Merge Levels — When two or more levels share the exact same price, their labels are combined into one (e.g. "WO / MO"), preventing label clutter at confluences.
Display Style — Lines can be drawn from where the period opened ("Standard") or anchored to a fixed distance from the right edge of the chart ("Right Anchored"), useful for keeping levels visible regardless of how far you've scrolled.
Global Coloring — A single master color can override all individual timeframe colors at once.
Shorthand Labels — Each group can be switched to abbreviated text (e.g. "PWH" instead of "Prev Week High") to reduce chart noise.
Line customisation — Width (Small/Medium/Large), style (Solid/Dashed/Dotted), and label size are all configurable globally.
The philosophy behind it
This is rooted in ICT (Inner Circle Trader) concepts — hence "IC" in the name. The idea is that institutional order flow tends to react at these periodic open/high/low prices because large participants reference the same levels. The Monday Range in particular is a key ICT concept, as Monday's price action is often considered a "draw" that the rest of the week either sweeps or respects. Session ranges (London, NY, Asia) are similarly used to identify where liquidity was taken and where price may return.
ICE CANDLE LOGIC INCLUDED
릴리즈 노트
Added When a 15m candle closes above a session or 4H high, or below a session or 4H low, that level is automatically removed from the chart. There is a toggle in both the FX Sessions and 4H settings groups to turn this on or off. It is off by default. 오픈 소스 스크립트
트레이딩뷰의 진정한 정신에 따라, 이 스크립트의 작성자는 이를 오픈소스로 공개하여 트레이더들이 기능을 검토하고 검증할 수 있도록 했습니다. 작성자에게 찬사를 보냅니다! 이 코드는 무료로 사용할 수 있지만, 코드를 재게시하는 경우 하우스 룰이 적용된다는 점을 기억하세요.

면책사항
해당 정보와 게시물은 금융, 투자, 트레이딩 또는 기타 유형의 조언이나 권장 사항으로 간주되지 않으며, 트레이딩뷰에서 제공하거나 보증하는 것이 아닙니다. 자세한 내용은 이용 약관을 참조하세요.
오픈 소스 스크립트
트레이딩뷰의 진정한 정신에 따라, 이 스크립트의 작성자는 이를 오픈소스로 공개하여 트레이더들이 기능을 검토하고 검증할 수 있도록 했습니다. 작성자에게 찬사를 보냅니다! 이 코드는 무료로 사용할 수 있지만, 코드를 재게시하는 경우 하우스 룰이 적용된다는 점을 기억하세요.
면책사항
해당 정보와 게시물은 금융, 투자, 트레이딩 또는 기타 유형의 조언이나 권장 사항으로 간주되지 않으며, 트레이딩뷰에서 제공하거나 보증하는 것이 아닙니다. 자세한 내용은 이용 약관을 참조하세요.