OPEN-SOURCE SCRIPT
Quant H - TradeRR
Quant H - TradeRR
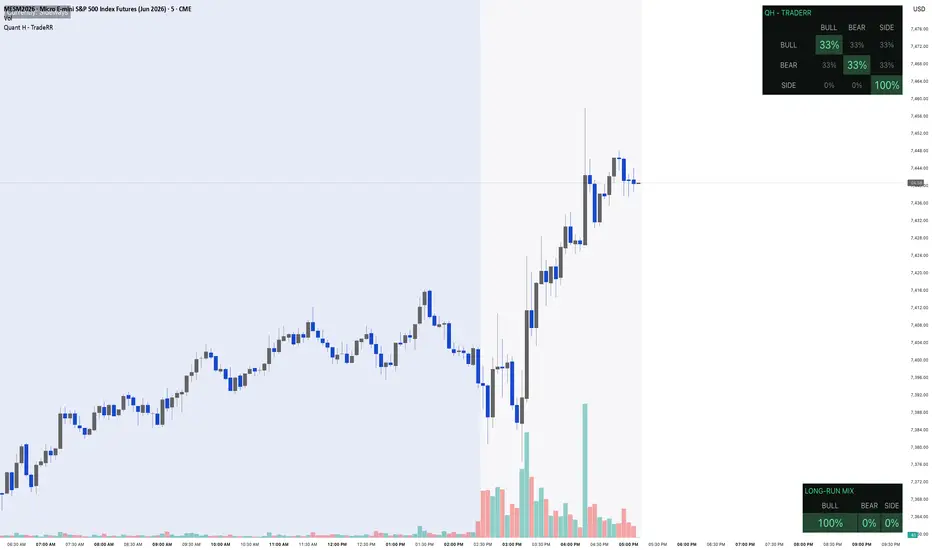
Quant H - TradeRR is a visual regime indicator that classifies market conditions into three states: Bull, Bear, and Sideways. It uses a rolling log-return model to label each bar, then builds a live transition matrix from chart history so you can see how likely the market is to remain in the current regime or shift into another one.
The core idea is simple: markets tend to move in persistent states, and those states can be measured. This script turns that into a clean on-chart framework by showing both the current regime and the probability structure behind it.
What it does
* Labels each bar as Bull, Bear, or Sideways
* Builds a live Markov transition matrix from visible chart history
* Highlights regime persistence through the diagonal probabilities
* Estimates the stationary distribution, showing the long-run regime mix
* Marks durable regime transitions directly on the chart
* Adds a subtle background ribbon so regime shifts are easy to spot visually
How to use it
* Best used on higher timeframes like 4H, Daily, and Weekly
* Works especially well on trending assets like indices, crypto, and liquid large caps
* Adjust the lookback window and thresholds to make regime detection tighter or looser
* Watch the diagonal of the matrix closely: higher diagonal values suggest stronger regime persistence
How to read it
* Bull: positive rolling return above the chosen threshold
* Bear: negative rolling return below the chosen threshold
* Sideways: anything in between
* Transition matrix: probability of moving from one regime to another
* Stationary distribution: the long-run baseline mix of Bull/Bear/Sideways regimes
Why it matters
Most indicators only tell you what price is doing now. This one helps frame what state the market is in, how sticky that state has been, and how often transitions happen. It is designed to support regime awareness, not replace your execution model.
Notes
* This is a probabilistic framework, not a prediction engine
* Results depend on the visible chart history and your chosen parameters
* Best used alongside structure, trend, volatility, and risk management
Disclaimer
This script is for educational and research purposes only. It is not financial advice.
Quant H - TradeRR is a visual regime indicator that classifies market conditions into three states: Bull, Bear, and Sideways. It uses a rolling log-return model to label each bar, then builds a live transition matrix from chart history so you can see how likely the market is to remain in the current regime or shift into another one.
The core idea is simple: markets tend to move in persistent states, and those states can be measured. This script turns that into a clean on-chart framework by showing both the current regime and the probability structure behind it.
What it does
* Labels each bar as Bull, Bear, or Sideways
* Builds a live Markov transition matrix from visible chart history
* Highlights regime persistence through the diagonal probabilities
* Estimates the stationary distribution, showing the long-run regime mix
* Marks durable regime transitions directly on the chart
* Adds a subtle background ribbon so regime shifts are easy to spot visually
How to use it
* Best used on higher timeframes like 4H, Daily, and Weekly
* Works especially well on trending assets like indices, crypto, and liquid large caps
* Adjust the lookback window and thresholds to make regime detection tighter or looser
* Watch the diagonal of the matrix closely: higher diagonal values suggest stronger regime persistence
How to read it
* Bull: positive rolling return above the chosen threshold
* Bear: negative rolling return below the chosen threshold
* Sideways: anything in between
* Transition matrix: probability of moving from one regime to another
* Stationary distribution: the long-run baseline mix of Bull/Bear/Sideways regimes
Why it matters
Most indicators only tell you what price is doing now. This one helps frame what state the market is in, how sticky that state has been, and how often transitions happen. It is designed to support regime awareness, not replace your execution model.
Notes
* This is a probabilistic framework, not a prediction engine
* Results depend on the visible chart history and your chosen parameters
* Best used alongside structure, trend, volatility, and risk management
Disclaimer
This script is for educational and research purposes only. It is not financial advice.
오픈 소스 스크립트
트레이딩뷰의 진정한 정신에 따라, 이 스크립트의 작성자는 이를 오픈소스로 공개하여 트레이더들이 기능을 검토하고 검증할 수 있도록 했습니다. 작성자에게 찬사를 보냅니다! 이 코드는 무료로 사용할 수 있지만, 코드를 재게시하는 경우 하우스 룰이 적용된다는 점을 기억하세요.

면책사항
해당 정보와 게시물은 금융, 투자, 트레이딩 또는 기타 유형의 조언이나 권장 사항으로 간주되지 않으며, 트레이딩뷰에서 제공하거나 보증하는 것이 아닙니다. 자세한 내용은 이용 약관을 참조하세요.
오픈 소스 스크립트
트레이딩뷰의 진정한 정신에 따라, 이 스크립트의 작성자는 이를 오픈소스로 공개하여 트레이더들이 기능을 검토하고 검증할 수 있도록 했습니다. 작성자에게 찬사를 보냅니다! 이 코드는 무료로 사용할 수 있지만, 코드를 재게시하는 경우 하우스 룰이 적용된다는 점을 기억하세요.
면책사항
해당 정보와 게시물은 금융, 투자, 트레이딩 또는 기타 유형의 조언이나 권장 사항으로 간주되지 않으며, 트레이딩뷰에서 제공하거나 보증하는 것이 아닙니다. 자세한 내용은 이용 약관을 참조하세요.