FRED: Credit Demand vs. Actual Loan Growth (Fixed YoY)
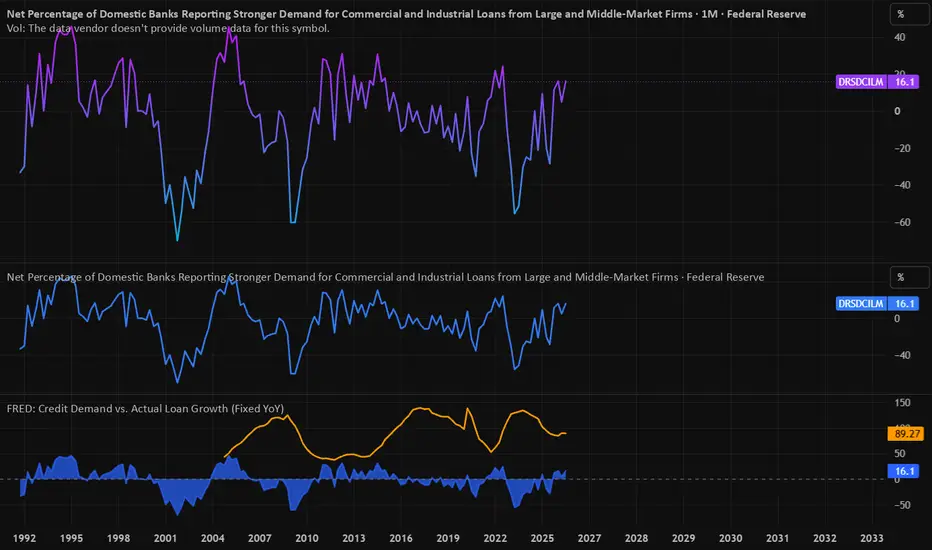
When a business decides it wants to expand, the process takes time:
1. Month 1 (Demand Spikes): The corporation applies for a massive expansion loan. The bank executive notes this on the Fed's survey, causing the Blue Area to turn upward immediately.
2. Months 2–3 (The Pipeline): The bank evaluates the collateral, structures the legal covenants, and approves the credit facility. No actual money has changed hands yet.
3. Months 4–12 (The Drawdown): The corporation slowly draws down the cash over the year to pay contractors, buy equipment, or build factories. Only now does the money appear on the bank’s balance sheet, causing the Orange Line to rise.
This is why you will see the Blue Area peak or bottom out months before the Orange Line follows it.
🔍 How to Analyze the Two Lines Together
When trading or analyzing the macro cycle, you want to watch the relationship between the two lines across three distinct market conditions:
1. Bullish Divergence (The Rebound Trigger)
• What it looks like: The Blue Area breaks above the 0.0 line and starts surging higher, but the Orange Line is still falling or stuck deep in the mud.
• What it means: This is a classic economic turning point. Businesses have recovered their appetite for risk and are actively asking for capital. It tells you that a massive wave of capital injection is locked into the pipeline and will hit the economy over the next two quarters.
2. Bearish Divergence (The Recession Warning)
• What it looks like: The Blue Area starts plunging rapidly toward or below the 0.0 line, but the Orange Line is still near its highs, looking perfectly healthy.
• What it means: This is a major macro red flag. Corporate CFOs have locked down their balance sheets and stopped applying for new debt because they anticipate economic trouble. The lagging Orange Line looks strong only because companies are finishing up older projects. Whenever you see the Blue Area collapse while the Orange Line is high, a growth slowdown is usually 6 months away.
3. Full Credit Expansion (The Current Phase)
• What it looks like: Both the Blue Area and the Orange Line are rising together comfortably above the zero line.
• What it means: The economic engine is firing on all cylinders. Corporate intent has successfully converted into real-world dollar creation. New money is actively circulating through the banking system to fund business expansion.
1. Month 1 (Demand Spikes): The corporation applies for a massive expansion loan. The bank executive notes this on the Fed's survey, causing the Blue Area to turn upward immediately.
2. Months 2–3 (The Pipeline): The bank evaluates the collateral, structures the legal covenants, and approves the credit facility. No actual money has changed hands yet.
3. Months 4–12 (The Drawdown): The corporation slowly draws down the cash over the year to pay contractors, buy equipment, or build factories. Only now does the money appear on the bank’s balance sheet, causing the Orange Line to rise.
This is why you will see the Blue Area peak or bottom out months before the Orange Line follows it.
🔍 How to Analyze the Two Lines Together
When trading or analyzing the macro cycle, you want to watch the relationship between the two lines across three distinct market conditions:
1. Bullish Divergence (The Rebound Trigger)
• What it looks like: The Blue Area breaks above the 0.0 line and starts surging higher, but the Orange Line is still falling or stuck deep in the mud.
• What it means: This is a classic economic turning point. Businesses have recovered their appetite for risk and are actively asking for capital. It tells you that a massive wave of capital injection is locked into the pipeline and will hit the economy over the next two quarters.
2. Bearish Divergence (The Recession Warning)
• What it looks like: The Blue Area starts plunging rapidly toward or below the 0.0 line, but the Orange Line is still near its highs, looking perfectly healthy.
• What it means: This is a major macro red flag. Corporate CFOs have locked down their balance sheets and stopped applying for new debt because they anticipate economic trouble. The lagging Orange Line looks strong only because companies are finishing up older projects. Whenever you see the Blue Area collapse while the Orange Line is high, a growth slowdown is usually 6 months away.
3. Full Credit Expansion (The Current Phase)
• What it looks like: Both the Blue Area and the Orange Line are rising together comfortably above the zero line.
• What it means: The economic engine is firing on all cylinders. Corporate intent has successfully converted into real-world dollar creation. New money is actively circulating through the banking system to fund business expansion.

면책사항
해당 정보와 게시물은 금융, 투자, 트레이딩 또는 기타 유형의 조언이나 권장 사항으로 간주되지 않으며, 트레이딩뷰에서 제공하거나 보증하는 것이 아닙니다. 자세한 내용은 이용 약관을 참조하세요.
면책사항
해당 정보와 게시물은 금융, 투자, 트레이딩 또는 기타 유형의 조언이나 권장 사항으로 간주되지 않으며, 트레이딩뷰에서 제공하거나 보증하는 것이 아닙니다. 자세한 내용은 이용 약관을 참조하세요.