OPEN-SOURCE SCRIPT
Auto Fibonacci Retracement [identityKa]
Overview
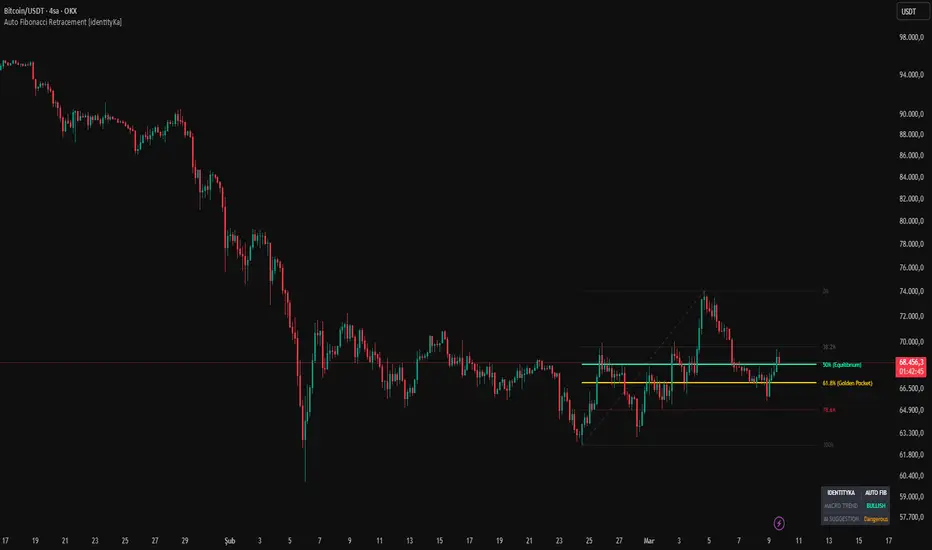
The Auto Fibonacci Retracement [identityKa] is a dynamic structural mapping tool designed to automate the process of drawing Fibonacci levels. By continually scanning historical price action over a user-defined lookback period, the script identifies the dominant macroeconomic Swing High and Swing Low. It then mathematically constructs the retracement zones in real-time, completely removing human subjectivity from technical analysis.
Core Mathematical Engine
The script utilizes the ta.highest and ta.lowest functions coupled with a structural array system to ensure flawless historical anchoring:
Trend Directionality: The script determines the current macro trend by calculating the chronological offset between the absolute High and absolute Low. If the Low occurred chronologically before the High, it establishes a Bullish bias and draws the Fibonacci ratios from bottom to top. Conversely, it draws from top to bottom for a Bearish bias.
Level Generation: Utilizing standard percentage retracements, the engine strictly plots the 0.382, 0.500 (Equilibrium), 0.618 (Golden Pocket), and 0.786 (Deep Retracement) levels. The lines are drawn using a smart array management system that clears old lines and strictly plots the active data on the live bar to prevent chart lag and clutter.
HUD Dashboard & AI Logic
To assist in reading the Fibonacci zones, an integrated on-chart panel evaluates the relationship between the live closing price and the drawn retracement levels:
Dangerous: Displayed whenever the current price enters the zone between the 0.382 and the 0.618 (Golden Pocket) levels. This area represents deep institutional retracement and is mathematically the highest-risk zone for trend-continuation entries, as the market is actively deciding whether to bounce or reverse.
LONG / SHORT: The engine defaults to the macro trend direction ("LONG" in an uptrend, "SHORT" in a downtrend) as long as the price remains confidently outside the deep retracement zone (e.g., above the 0.382 in a bullish trend), signifying that the primary momentum remains intact. If the deep 0.786 level is broken against the trend, the script will mathematically flip the bias, assuming a structural reversal.
How to Use It
Traders should use this script to automate their top-down analysis. Rather than manually redrawing Fibonacci levels as new highs or lows are made, this indicator updates dynamically. During an established trend, traders should look for the AI Suggestion to switch to "Dangerous" (indicating price has entered the Golden Pocket) and await a definitive candlestick rejection pattern off the 0.500 or 0.618 level before re-entering the market in the direction of the macro trend.
The Auto Fibonacci Retracement [identityKa] is a dynamic structural mapping tool designed to automate the process of drawing Fibonacci levels. By continually scanning historical price action over a user-defined lookback period, the script identifies the dominant macroeconomic Swing High and Swing Low. It then mathematically constructs the retracement zones in real-time, completely removing human subjectivity from technical analysis.
Core Mathematical Engine
The script utilizes the ta.highest and ta.lowest functions coupled with a structural array system to ensure flawless historical anchoring:
Trend Directionality: The script determines the current macro trend by calculating the chronological offset between the absolute High and absolute Low. If the Low occurred chronologically before the High, it establishes a Bullish bias and draws the Fibonacci ratios from bottom to top. Conversely, it draws from top to bottom for a Bearish bias.
Level Generation: Utilizing standard percentage retracements, the engine strictly plots the 0.382, 0.500 (Equilibrium), 0.618 (Golden Pocket), and 0.786 (Deep Retracement) levels. The lines are drawn using a smart array management system that clears old lines and strictly plots the active data on the live bar to prevent chart lag and clutter.
HUD Dashboard & AI Logic
To assist in reading the Fibonacci zones, an integrated on-chart panel evaluates the relationship between the live closing price and the drawn retracement levels:
Dangerous: Displayed whenever the current price enters the zone between the 0.382 and the 0.618 (Golden Pocket) levels. This area represents deep institutional retracement and is mathematically the highest-risk zone for trend-continuation entries, as the market is actively deciding whether to bounce or reverse.
LONG / SHORT: The engine defaults to the macro trend direction ("LONG" in an uptrend, "SHORT" in a downtrend) as long as the price remains confidently outside the deep retracement zone (e.g., above the 0.382 in a bullish trend), signifying that the primary momentum remains intact. If the deep 0.786 level is broken against the trend, the script will mathematically flip the bias, assuming a structural reversal.
How to Use It
Traders should use this script to automate their top-down analysis. Rather than manually redrawing Fibonacci levels as new highs or lows are made, this indicator updates dynamically. During an established trend, traders should look for the AI Suggestion to switch to "Dangerous" (indicating price has entered the Golden Pocket) and await a definitive candlestick rejection pattern off the 0.500 or 0.618 level before re-entering the market in the direction of the macro trend.
오픈 소스 스크립트
트레이딩뷰의 진정한 정신에 따라, 이 스크립트의 작성자는 이를 오픈소스로 공개하여 트레이더들이 기능을 검토하고 검증할 수 있도록 했습니다. 작성자에게 찬사를 보냅니다! 이 코드는 무료로 사용할 수 있지만, 코드를 재게시하는 경우 하우스 룰이 적용된다는 점을 기억하세요.

면책사항
해당 정보와 게시물은 금융, 투자, 트레이딩 또는 기타 유형의 조언이나 권장 사항으로 간주되지 않으며, 트레이딩뷰에서 제공하거나 보증하는 것이 아닙니다. 자세한 내용은 이용 약관을 참조하세요.
오픈 소스 스크립트
트레이딩뷰의 진정한 정신에 따라, 이 스크립트의 작성자는 이를 오픈소스로 공개하여 트레이더들이 기능을 검토하고 검증할 수 있도록 했습니다. 작성자에게 찬사를 보냅니다! 이 코드는 무료로 사용할 수 있지만, 코드를 재게시하는 경우 하우스 룰이 적용된다는 점을 기억하세요.
면책사항
해당 정보와 게시물은 금융, 투자, 트레이딩 또는 기타 유형의 조언이나 권장 사항으로 간주되지 않으며, 트레이딩뷰에서 제공하거나 보증하는 것이 아닙니다. 자세한 내용은 이용 약관을 참조하세요.