OPEN-SOURCE SCRIPT
[Kpt-Ahab] HeatMap Fusion
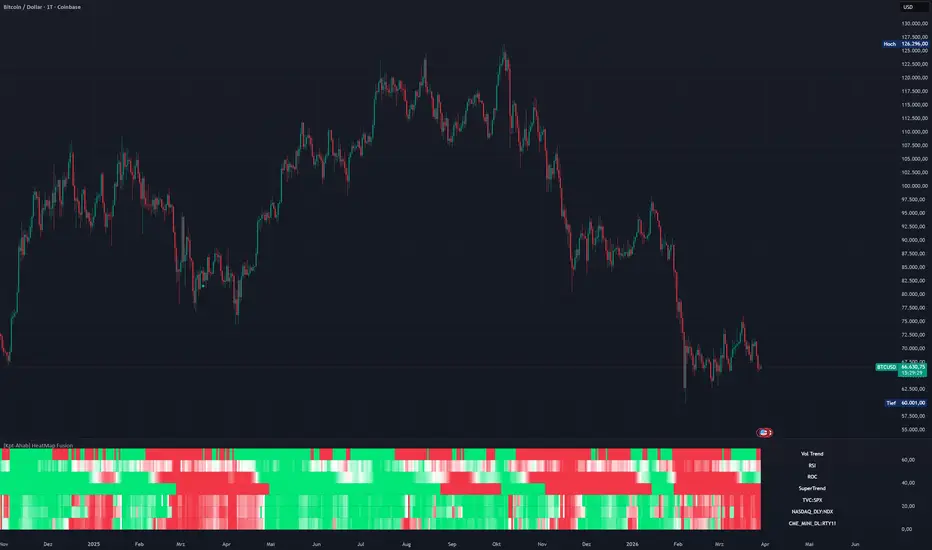
What is “HeatMap Fusion”?
HeatMap Fusion merges RSI, Volume Trend, ROC and an enhanced SuperTrend into one stacked heat-map. Smooth colour gradients reveal—at a glance—whether each component is bullish, neutral, or bearish, without cluttering the chart with multiple separate panes.
Key Features
Multi-indicator heat-map
Three symbols with volume- or price-based colouring.
RSI, ROC and SuperTrend share the same colour scale → instant market-breadth read-out.
View switcher – choose RSI, ROC, SuperTrend, Volume SMA, Up/Down Volume or ALL from a single dropdown.
Six colour schemes (red⇅green, purple⇅blue, etc.) for both light and dark layouts.
Optional RSI divergence detection.
Heikin-Ashi–driven SuperTrend plus Rapid Volatility Trend lines.
Performance-optimised – only three request.security() calls for the selected symbols.
Inputs
Group Core settings
Indicator Layer to display
Color Scheme (Heatmap) 6 presets
Symbol 3 tickers, volume/price mode, look-back length
RSI Period, MA type, BB width, divergence flag
Volume Trend SMA length, up/down columns
ROC Period & intensity threshold
SuperTrend Two ATR sets, Heikin-Ashi on/off
(Every parameter is commented inside the script.)
How to Use
Add the script to any chart.
Set SymCal to on when your symbol has real volume data (futures, ETFs, equities).
Replace the three default tickers with your own—e.g. ES1!, ZB1!, CL1! for a macro setup.
Pick a colour scheme; Purple ⇅ Blue looks great on dark backgrounds.
Choose ALL for the full heat-map with labels, or isolate any single layer via the dropdown.
Notes
The heat-map lives in the main pane on fixed Y-bands (0 – 70). Do not enable Auto-Fit scaling.
If a symbol has no volume, SymCal = on yields no colouring—switch it off to fall back to price-based gradients.
HeatMap Fusion merges RSI, Volume Trend, ROC and an enhanced SuperTrend into one stacked heat-map. Smooth colour gradients reveal—at a glance—whether each component is bullish, neutral, or bearish, without cluttering the chart with multiple separate panes.
Key Features
Multi-indicator heat-map
Three symbols with volume- or price-based colouring.
RSI, ROC and SuperTrend share the same colour scale → instant market-breadth read-out.
View switcher – choose RSI, ROC, SuperTrend, Volume SMA, Up/Down Volume or ALL from a single dropdown.
Six colour schemes (red⇅green, purple⇅blue, etc.) for both light and dark layouts.
Optional RSI divergence detection.
Heikin-Ashi–driven SuperTrend plus Rapid Volatility Trend lines.
Performance-optimised – only three request.security() calls for the selected symbols.
Inputs
Group Core settings
Indicator Layer to display
Color Scheme (Heatmap) 6 presets
Symbol 3 tickers, volume/price mode, look-back length
RSI Period, MA type, BB width, divergence flag
Volume Trend SMA length, up/down columns
ROC Period & intensity threshold
SuperTrend Two ATR sets, Heikin-Ashi on/off
(Every parameter is commented inside the script.)
How to Use
Add the script to any chart.
Set SymCal to on when your symbol has real volume data (futures, ETFs, equities).
Replace the three default tickers with your own—e.g. ES1!, ZB1!, CL1! for a macro setup.
Pick a colour scheme; Purple ⇅ Blue looks great on dark backgrounds.
Choose ALL for the full heat-map with labels, or isolate any single layer via the dropdown.
Notes
The heat-map lives in the main pane on fixed Y-bands (0 – 70). Do not enable Auto-Fit scaling.
If a symbol has no volume, SymCal = on yields no colouring—switch it off to fall back to price-based gradients.
오픈 소스 스크립트
트레이딩뷰의 진정한 정신에 따라, 이 스크립트의 작성자는 이를 오픈소스로 공개하여 트레이더들이 기능을 검토하고 검증할 수 있도록 했습니다. 작성자에게 찬사를 보냅니다! 이 코드는 무료로 사용할 수 있지만, 코드를 재게시하는 경우 하우스 룰이 적용된다는 점을 기억하세요.

면책사항
해당 정보와 게시물은 금융, 투자, 트레이딩 또는 기타 유형의 조언이나 권장 사항으로 간주되지 않으며, 트레이딩뷰에서 제공하거나 보증하는 것이 아닙니다. 자세한 내용은 이용 약관을 참조하세요.
오픈 소스 스크립트
트레이딩뷰의 진정한 정신에 따라, 이 스크립트의 작성자는 이를 오픈소스로 공개하여 트레이더들이 기능을 검토하고 검증할 수 있도록 했습니다. 작성자에게 찬사를 보냅니다! 이 코드는 무료로 사용할 수 있지만, 코드를 재게시하는 경우 하우스 룰이 적용된다는 점을 기억하세요.
면책사항
해당 정보와 게시물은 금융, 투자, 트레이딩 또는 기타 유형의 조언이나 권장 사항으로 간주되지 않으며, 트레이딩뷰에서 제공하거나 보증하는 것이 아닙니다. 자세한 내용은 이용 약관을 참조하세요.