OPEN-SOURCE SCRIPT
FVG & iFVG (Yair_Misgav)
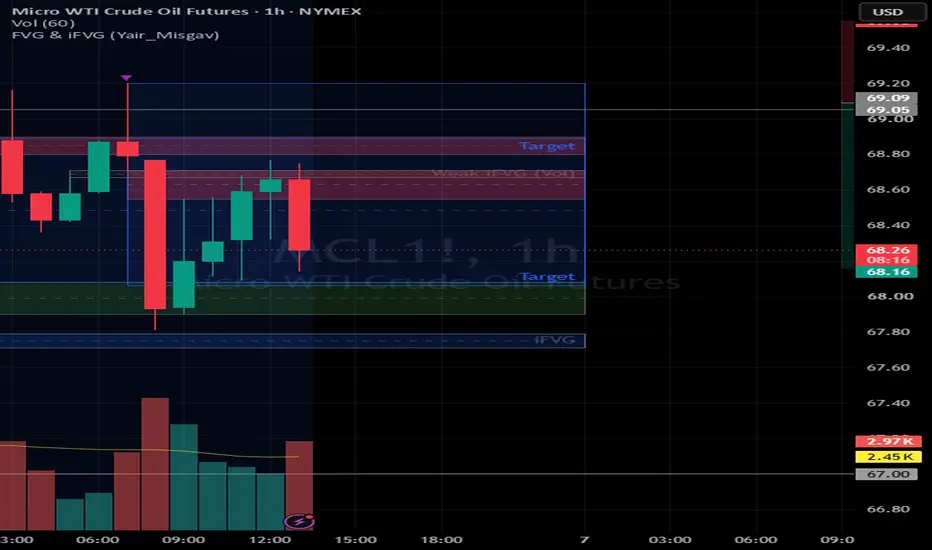
This indicator provides automated identification, filtering, and management of Fair Value Gaps (FVG) and Inversion Fair Value Gaps (iFVG). It is designed for traders utilizing Smart Money Concepts (SMC) who require a systematic approach to identifying liquidity and structural imbalances.
Key Technical Features:
Algorithmic Detection: Identifies gaps in price action based on structural imbalances, with integrated filters for Volume SMA and Body-to-Range ratios to ensure only high-momentum zones are prioritized.
Dynamic Inversion Engine: Automatically transitions identified FVGs into iFVGs once price penetrates the zone, reclassifying support-turned-resistance (or vice versa) to maintain structural accuracy.
Symmetrical Projection (Measured Move): Calculates and projects target zones based on the structural swing origin. This feature includes an optional midline toggle for precise assessment of potential profit targets or reversal areas.
Configurable Visualization: Offers dual extension modes (Fixed vs. Dynamic to Last Bar) and customizable lookback periods to manage chart density and historical tracking.
Visual Logic: Provides clear, configurable styling options for borders, midlines, and labeling, allowing for seamless integration into existing technical chart setups.
Note: This tool is intended for structural analysis and should be used in conjunction with a robust risk management strategy.
Key Technical Features:
Algorithmic Detection: Identifies gaps in price action based on structural imbalances, with integrated filters for Volume SMA and Body-to-Range ratios to ensure only high-momentum zones are prioritized.
Dynamic Inversion Engine: Automatically transitions identified FVGs into iFVGs once price penetrates the zone, reclassifying support-turned-resistance (or vice versa) to maintain structural accuracy.
Symmetrical Projection (Measured Move): Calculates and projects target zones based on the structural swing origin. This feature includes an optional midline toggle for precise assessment of potential profit targets or reversal areas.
Configurable Visualization: Offers dual extension modes (Fixed vs. Dynamic to Last Bar) and customizable lookback periods to manage chart density and historical tracking.
Visual Logic: Provides clear, configurable styling options for borders, midlines, and labeling, allowing for seamless integration into existing technical chart setups.
Note: This tool is intended for structural analysis and should be used in conjunction with a robust risk management strategy.
오픈 소스 스크립트
트레이딩뷰의 진정한 정신에 따라, 이 스크립트의 작성자는 이를 오픈소스로 공개하여 트레이더들이 기능을 검토하고 검증할 수 있도록 했습니다. 작성자에게 찬사를 보냅니다! 이 코드는 무료로 사용할 수 있지만, 코드를 재게시하는 경우 하우스 룰이 적용된다는 점을 기억하세요.

면책사항
해당 정보와 게시물은 금융, 투자, 트레이딩 또는 기타 유형의 조언이나 권장 사항으로 간주되지 않으며, 트레이딩뷰에서 제공하거나 보증하는 것이 아닙니다. 자세한 내용은 이용 약관을 참조하세요.
오픈 소스 스크립트
트레이딩뷰의 진정한 정신에 따라, 이 스크립트의 작성자는 이를 오픈소스로 공개하여 트레이더들이 기능을 검토하고 검증할 수 있도록 했습니다. 작성자에게 찬사를 보냅니다! 이 코드는 무료로 사용할 수 있지만, 코드를 재게시하는 경우 하우스 룰이 적용된다는 점을 기억하세요.
면책사항
해당 정보와 게시물은 금융, 투자, 트레이딩 또는 기타 유형의 조언이나 권장 사항으로 간주되지 않으며, 트레이딩뷰에서 제공하거나 보증하는 것이 아닙니다. 자세한 내용은 이용 약관을 참조하세요.