OPEN-SOURCE SCRIPT
Market Correlation Matrix [NikaQuant]
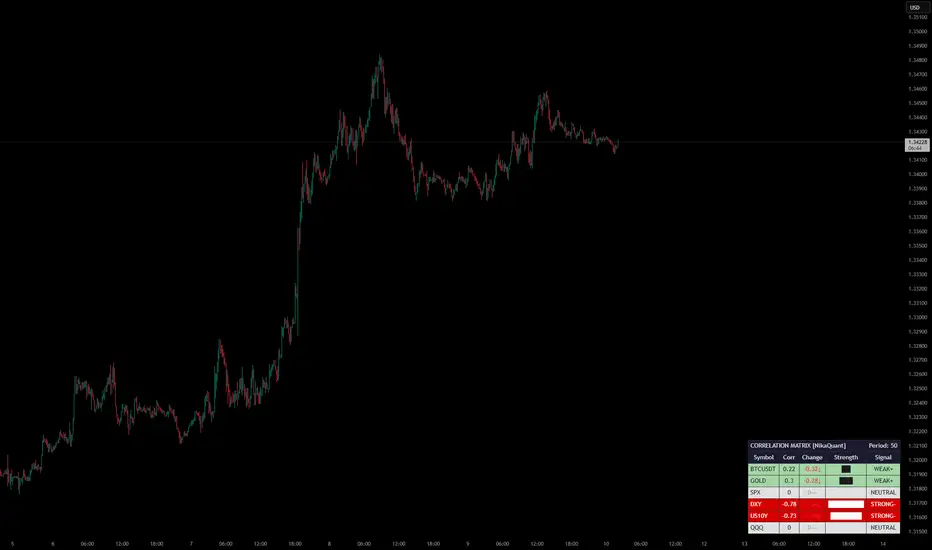
Market Correlation Matrix [NikaQuant]
A real-time correlation dashboard that displays Pearson correlation coefficients between the current chart symbol and up to 6 user-defined comparison symbols.
═══ FEATURES ═══
• Track correlations for up to 6 symbols simultaneously (default: BTCUSDT, GOLD, SPX, DXY, US10Y, QQQ)
• Heatmap-colored table with intuitive color coding from strong positive (green) to strong negative (red)
• Correlation change tracking — see how correlations are shifting over a configurable lookback period
• Visual strength bars showing absolute correlation magnitude at a glance
• Signal classification labels: STRONG+/-, MOD+/-, WEAK+/-, NEUTRAL
• Built-in alerts for strong positive/negative crosses (±0.7) and zero-line crosses
• Fully customizable: table position, text size, all colors, border styling
═══ HOW IT WORKS ═══
The indicator calculates Pearson correlation over a user-defined period (default: 50 bars) between the chart’s close price and each comparison symbol’s close price. It then renders a compact table showing:
1. Symbol — Ticker of the comparison asset
2. Corr — Current correlation value (-1 to +1)
3. Change — How much the correlation shifted vs N bars ago (with directional arrows)
4. Strength — Block-style visual bar representing absolute correlation
5. Signal — Classification from NEUTRAL to STRONG+/-
═══ SETTINGS ═══
Symbols: Configure up to 6 comparison symbols (leave blank to skip)
Correlation Period: Lookback length for Pearson calculation (default: 50)
Change Lookback: Compare current vs past correlation (default: 10 bars)
Display: Table position, show/hide title
Style: Full color customization for heatmap, headers, borders, and change indicators
═══ ALERTS ═══
• Strong positive correlation cross (above +0.7) per symbol
• Strong negative correlation cross (below -0.7) per symbol
• Any symbol crossing the zero line
═══ USE CASES ═══
• Monitor intermarket relationships in real time
• Identify regime changes when correlations break down or strengthen
• Confirm or filter trade setups using cross-asset correlation context
• Track USD, bonds, equities, and crypto correlations from a single chart
A real-time correlation dashboard that displays Pearson correlation coefficients between the current chart symbol and up to 6 user-defined comparison symbols.
═══ FEATURES ═══
• Track correlations for up to 6 symbols simultaneously (default: BTCUSDT, GOLD, SPX, DXY, US10Y, QQQ)
• Heatmap-colored table with intuitive color coding from strong positive (green) to strong negative (red)
• Correlation change tracking — see how correlations are shifting over a configurable lookback period
• Visual strength bars showing absolute correlation magnitude at a glance
• Signal classification labels: STRONG+/-, MOD+/-, WEAK+/-, NEUTRAL
• Built-in alerts for strong positive/negative crosses (±0.7) and zero-line crosses
• Fully customizable: table position, text size, all colors, border styling
═══ HOW IT WORKS ═══
The indicator calculates Pearson correlation over a user-defined period (default: 50 bars) between the chart’s close price and each comparison symbol’s close price. It then renders a compact table showing:
1. Symbol — Ticker of the comparison asset
2. Corr — Current correlation value (-1 to +1)
3. Change — How much the correlation shifted vs N bars ago (with directional arrows)
4. Strength — Block-style visual bar representing absolute correlation
5. Signal — Classification from NEUTRAL to STRONG+/-
═══ SETTINGS ═══
Symbols: Configure up to 6 comparison symbols (leave blank to skip)
Correlation Period: Lookback length for Pearson calculation (default: 50)
Change Lookback: Compare current vs past correlation (default: 10 bars)
Display: Table position, show/hide title
Style: Full color customization for heatmap, headers, borders, and change indicators
═══ ALERTS ═══
• Strong positive correlation cross (above +0.7) per symbol
• Strong negative correlation cross (below -0.7) per symbol
• Any symbol crossing the zero line
═══ USE CASES ═══
• Monitor intermarket relationships in real time
• Identify regime changes when correlations break down or strengthen
• Confirm or filter trade setups using cross-asset correlation context
• Track USD, bonds, equities, and crypto correlations from a single chart
오픈 소스 스크립트
트레이딩뷰의 진정한 정신에 따라, 이 스크립트의 작성자는 이를 오픈소스로 공개하여 트레이더들이 기능을 검토하고 검증할 수 있도록 했습니다. 작성자에게 찬사를 보냅니다! 이 코드는 무료로 사용할 수 있지만, 코드를 재게시하는 경우 하우스 룰이 적용된다는 점을 기억하세요.

면책사항
해당 정보와 게시물은 금융, 투자, 트레이딩 또는 기타 유형의 조언이나 권장 사항으로 간주되지 않으며, 트레이딩뷰에서 제공하거나 보증하는 것이 아닙니다. 자세한 내용은 이용 약관을 참조하세요.
오픈 소스 스크립트
트레이딩뷰의 진정한 정신에 따라, 이 스크립트의 작성자는 이를 오픈소스로 공개하여 트레이더들이 기능을 검토하고 검증할 수 있도록 했습니다. 작성자에게 찬사를 보냅니다! 이 코드는 무료로 사용할 수 있지만, 코드를 재게시하는 경우 하우스 룰이 적용된다는 점을 기억하세요.
면책사항
해당 정보와 게시물은 금융, 투자, 트레이딩 또는 기타 유형의 조언이나 권장 사항으로 간주되지 않으며, 트레이딩뷰에서 제공하거나 보증하는 것이 아닙니다. 자세한 내용은 이용 약관을 참조하세요.