업데이트됨
TimeLy Moving Average - TMA
More exclusive indicators from only_fibonacci
Subscribe to TrendLAB for $4.99/month to get exclusive indicators by this author. You pay right on TradingView and can use them on your charts straight away.
Explore TrendLABHello traders, I'm Only Fibonacci.
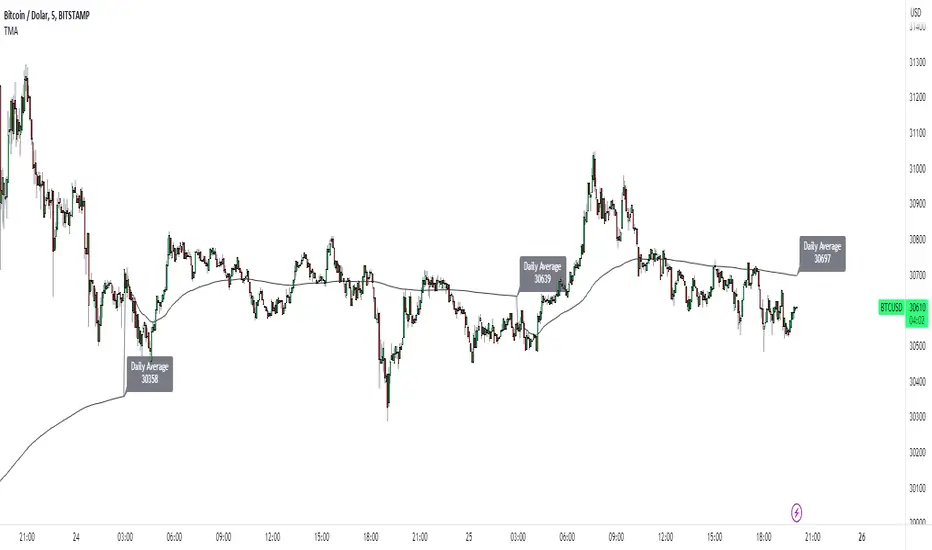
With this indicator, you will see the averages according to the hourly, weekly and monthly price movements in many periods on the chart.
This will show you the moving average values of the price over different periods in a progressive manner on the chart that is open to you.
Options and Usage

To see the hourly average, your chart's time range must be less than or equal to 60 minutes, otherwise it will produce a NaN value.
In order to see the daily average, your chart must be open for any minute period or (even if the second is open, it must be greater than 6 seconds). Otherwise, it does not produce any value.
Your chart must be larger than the second chart to see the weekly average. In other words, you can see the weekly average with at least 1 minute chart open.
In order to see the monthly average, your chart time interval must be above 10 minutes, otherwise you will not be able to see data again.
Settings
You choose the moving average type and the time interval value you want to see from the indicator settings.
You can also select a source for moving averages.
Enjoy it, you can make improvements on it.
Please do not forget to comment for various bug reports.
With this indicator, you will see the averages according to the hourly, weekly and monthly price movements in many periods on the chart.
This will show you the moving average values of the price over different periods in a progressive manner on the chart that is open to you.
Options and Usage
To see the hourly average, your chart's time range must be less than or equal to 60 minutes, otherwise it will produce a NaN value.
In order to see the daily average, your chart must be open for any minute period or (even if the second is open, it must be greater than 6 seconds). Otherwise, it does not produce any value.
Your chart must be larger than the second chart to see the weekly average. In other words, you can see the weekly average with at least 1 minute chart open.
In order to see the monthly average, your chart time interval must be above 10 minutes, otherwise you will not be able to see data again.
Settings
You choose the moving average type and the time interval value you want to see from the indicator settings.
You can also select a source for moving averages.
Enjoy it, you can make improvements on it.
Please do not forget to comment for various bug reports.
릴리즈 노트
Name edit.
Love for AlgoTrading
면책사항
해당 정보와 게시물은 금융, 투자, 트레이딩 또는 기타 유형의 조언이나 권장 사항으로 간주되지 않으며, 트레이딩뷰에서 제공하거나 보증하는 것이 아닙니다. 자세한 내용은 이용 약관을 참조하세요.
Love for AlgoTrading
면책사항
해당 정보와 게시물은 금융, 투자, 트레이딩 또는 기타 유형의 조언이나 권장 사항으로 간주되지 않으며, 트레이딩뷰에서 제공하거나 보증하는 것이 아닙니다. 자세한 내용은 이용 약관을 참조하세요.