OPEN-SOURCE SCRIPT
Sonic R (13-34-89) by DQT
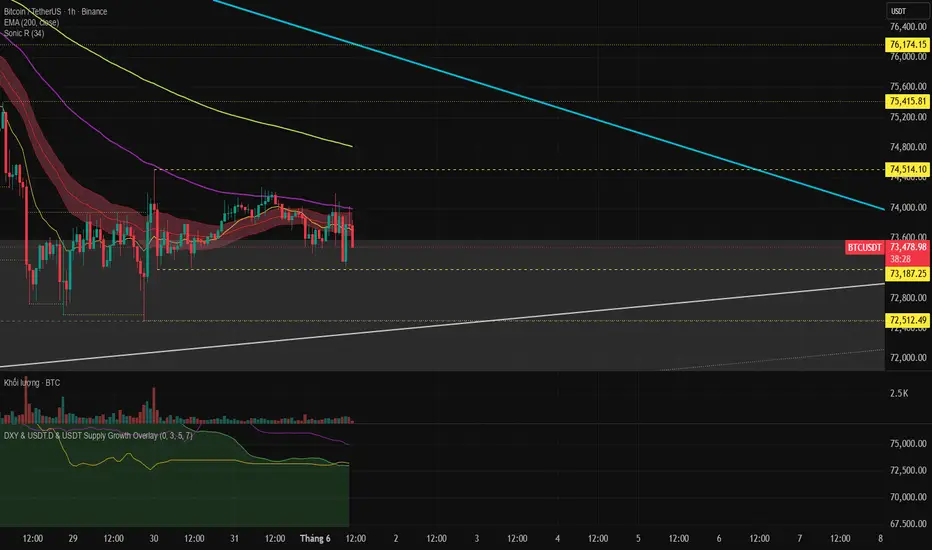
Sonic R System - EMA 13-34-89-200
Description:
The Sonic R indicator is built upon a multi-layered Exponential Moving Average (EMA) system combined with a Price Action Channel (PAC), designed to identify market trends, dynamic support/resistance zones, and high-probability trade entries.
Core Components:
1. Price Action Channel (PAC) — EMA 34 Band
The PAC is calculated using EMA 34 applied to High, Low, and Close prices, forming a dynamic channel that represents the short-term equilibrium zone. Price above the channel signals bullish momentum; price below signals bearish pressure.
2. EMA Trend System:
🟡 EMA 13 — Fast-reacting short-term trend, captures immediate price momentum
🔴 EMA 34 — Core support/resistance zone displayed as a red band, acts as the market's heartbeat
🟣 EMA 89 — Medium-term trend filter, smooths out market noise
🟢 EMA 200 — Long-term trend anchor, defines the overall market direction
How to Use:
Price above all EMAs → strong uptrend, prioritize buy setups
Price below all EMAs → strong downtrend, prioritize sell setups
Price inside the red EMA 34 band → market consolidating, wait for breakout confirmation
EMAs stacked in order (13 > 34 > 89 > 200) → trend is clean and strong, highest confidence entries
Best Used On: All timeframes — most effective on H1, H4, and Daily charts.
Description:
The Sonic R indicator is built upon a multi-layered Exponential Moving Average (EMA) system combined with a Price Action Channel (PAC), designed to identify market trends, dynamic support/resistance zones, and high-probability trade entries.
Core Components:
1. Price Action Channel (PAC) — EMA 34 Band
The PAC is calculated using EMA 34 applied to High, Low, and Close prices, forming a dynamic channel that represents the short-term equilibrium zone. Price above the channel signals bullish momentum; price below signals bearish pressure.
2. EMA Trend System:
🟡 EMA 13 — Fast-reacting short-term trend, captures immediate price momentum
🔴 EMA 34 — Core support/resistance zone displayed as a red band, acts as the market's heartbeat
🟣 EMA 89 — Medium-term trend filter, smooths out market noise
🟢 EMA 200 — Long-term trend anchor, defines the overall market direction
How to Use:
Price above all EMAs → strong uptrend, prioritize buy setups
Price below all EMAs → strong downtrend, prioritize sell setups
Price inside the red EMA 34 band → market consolidating, wait for breakout confirmation
EMAs stacked in order (13 > 34 > 89 > 200) → trend is clean and strong, highest confidence entries
Best Used On: All timeframes — most effective on H1, H4, and Daily charts.
오픈 소스 스크립트
트레이딩뷰의 진정한 정신에 따라, 이 스크립트의 작성자는 이를 오픈소스로 공개하여 트레이더들이 기능을 검토하고 검증할 수 있도록 했습니다. 작성자에게 찬사를 보냅니다! 이 코드는 무료로 사용할 수 있지만, 코드를 재게시하는 경우 하우스 룰이 적용된다는 점을 기억하세요.

면책사항
해당 정보와 게시물은 금융, 투자, 트레이딩 또는 기타 유형의 조언이나 권장 사항으로 간주되지 않으며, 트레이딩뷰에서 제공하거나 보증하는 것이 아닙니다. 자세한 내용은 이용 약관을 참조하세요.
오픈 소스 스크립트
트레이딩뷰의 진정한 정신에 따라, 이 스크립트의 작성자는 이를 오픈소스로 공개하여 트레이더들이 기능을 검토하고 검증할 수 있도록 했습니다. 작성자에게 찬사를 보냅니다! 이 코드는 무료로 사용할 수 있지만, 코드를 재게시하는 경우 하우스 룰이 적용된다는 점을 기억하세요.
면책사항
해당 정보와 게시물은 금융, 투자, 트레이딩 또는 기타 유형의 조언이나 권장 사항으로 간주되지 않으며, 트레이딩뷰에서 제공하거나 보증하는 것이 아닙니다. 자세한 내용은 이용 약관을 참조하세요.