OPEN-SOURCE SCRIPT
업데이트됨 SQZPRO + RSI Divergence
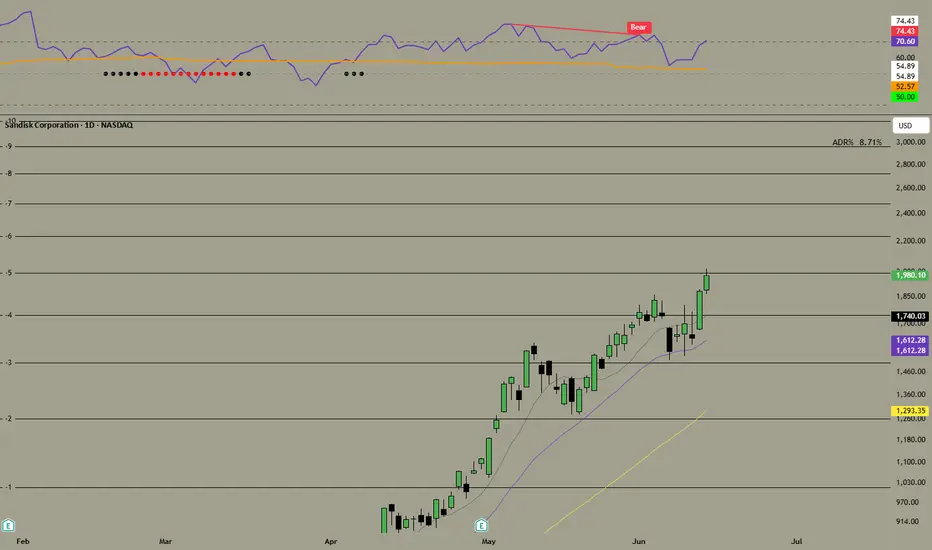
This indicator combines two tools in a single sub-pane below your chart:
RSI (top half of the logic) — a standard RSI plotted on its usual 0–100 scale, with horizontal lines at 70 (overbought), 50 (midline), and 30 (oversold). Length and source are configurable.
Squeeze PRO (volatility compression) — it compares Bollinger Bands (2 standard deviations) against three Keltner Channel widths (1x, 1.5x, and 2x average true range). Depending on how tightly the Bollinger Bands are nested inside those channels, it classifies the current bar into one of five states, each shown as a colored dot sitting on the RSI's 50-line:
Blue — transitional/no clear squeeze
Yellow — narrow squeeze (tightest compression, most "coiled")
Red — normal squeeze
Black — wide squeeze (loosest compression, but still squeezed)
Green — squeeze released (bands have expanded outward — volatility breakout in progress)
There's also an optional momentum histogram (off by default, toggle "Show MOM Histogram") that shows a linear-regression-based momentum oscillator, similar to the classic squeeze momentum indicator.
RSI Divergence — this scans for pivot highs/lows in the RSI and compares them to price pivots over the same span. When RSI and price disagree, it draws a short line connecting the two RSI pivot points plus a label, directly on the RSI plot:
"Bull" (regular bullish, green) — price made a lower low but RSI made a higher low; potential reversal up
"Bear" (regular bearish, red) — price made a higher high but RSI made a lower high; potential reversal down
"H Bull" / "H Bear" (hidden divergences, dimmer colors, off by default) — typically signal trend continuation rather than reversal
These signals are confirmed lbR bars (default 5) after the actual pivot, which is normal for any divergence tool — it trades a small delay for fewer false signals.
Confluence — the script tracks when a squeeze "fires" (transitions to the green/released state) and checks whether a divergence occurred on that same bar. If both line up, it triggers a separate "Bullish Confluence" or "Bearish Confluence" alert — the idea being that a volatility expansion plus a divergence in the same direction is a stronger combined signal than either alone.
Alerts are set up for every divergence type, for squeeze release on its own, and for the two confluence cases, so you can build alerts off whichever combination matters to you.
릴리즈 노트
This indicator combines two tools in a single sub-pane below your chart:RSI (top half of the logic) — a standard RSI plotted on its usual 0–100 scale, with horizontal lines at 70 (overbought), 50 (midline), and 30 (oversold). Length and source are configurable.
Squeeze PRO (volatility compression) — it compares Bollinger Bands (2 standard deviations) against three Keltner Channel widths (1x, 1.5x, and 2x average true range). Depending on how tightly the Bollinger Bands are nested inside those channels, it classifies the current bar into one of five states, each shown as a colored dot sitting on the RSI's 50-line:
Blue — transitional/no clear squeeze
Yellow — narrow squeeze (tightest compression, most "coiled")
Red — normal squeeze
Black — wide squeeze (loosest compression, but still squeezed)
Green — squeeze released (bands have expanded outward — volatility breakout in progress)
There's also an optional momentum histogram (off by default, toggle "Show MOM Histogram") that shows a linear-regression-based momentum oscillator, similar to the classic squeeze momentum indicator.
RSI Divergence — this scans for pivot highs/lows in the RSI and compares them to price pivots over the same span. When RSI and price disagree, it draws a short line connecting the two RSI pivot points plus a label, directly on the RSI plot:
"Bull" (regular bullish, green) — price made a lower low but RSI made a higher low; potential reversal up
"Bear" (regular bearish, red) — price made a higher high but RSI made a lower high; potential reversal down
"H Bull" / "H Bear" (hidden divergences, dimmer colors, off by default) — typically signal trend continuation rather than reversal
These signals are confirmed lbR bars (default 5) after the actual pivot, which is normal for any divergence tool — it trades a small delay for fewer false signals.
Confluence — the script tracks when a squeeze "fires" (transitions to the green/released state) and checks whether a divergence occurred on that same bar. If both line up, it triggers a separate "Bullish Confluence" or "Bearish Confluence" alert — the idea being that a volatility expansion plus a divergence in the same direction is a stronger combined signal than either alone.
Alerts are set up for every divergence type, for squeeze release on its own, and for the two confluence cases, so you can build alerts off whichever combination matters to you.
20 hours ago
Release Notes
This indicator combines two tools in a single sub-pane below your chart:
RSI (top half of the logic) — a standard RSI plotted on its usual 0–100 scale, with horizontal lines at 70 (overbought), 50 (midline), and 30 (oversold). Length and source are configurable.
Squeeze PRO (volatility compression) — it compares Bollinger Bands (2 standard deviations) against three Keltner Channel widths (1x, 1.5x, and 2x average true range). Depending on how tightly the Bollinger Bands are nested inside those channels, it classifies the current bar into one of five states, each shown as a colored dot sitting on the RSI's 50-line:
Blue — transitional/no clear squeeze
Yellow — narrow squeeze (tightest compression, most "coiled")
Red — normal squeeze
Black — wide squeeze (loosest compression, but still squeezed)
Green — squeeze released (bands have expanded outward — volatility breakout in progress)
There's also an optional momentum histogram (off by default, toggle "Show MOM Histogram") that shows a linear-regression-based momentum oscillator, similar to the classic squeeze momentum indicator.
RSI Divergence — this scans for pivot highs/lows in the RSI and compares them to price pivots over the same span. When RSI and price disagree, it draws a short line connecting the two RSI pivot points plus a label, directly on the RSI plot:
"Bull" (regular bullish, green) — price made a lower low but RSI made a higher low; potential reversal up
"Bear" (regular bearish, red) — price made a higher high but RSI made a lower high; potential reversal down
"H Bull" / "H Bear" (hidden divergences, dimmer colors, off by default) — typically signal trend continuation rather than reversal
These signals are confirmed lbR bars (default 5) after the actual pivot, which is normal for any divergence tool — it trades a small delay for fewer false signals.
Confluence — the script tracks when a squeeze "fires" (transitions to the green/released state) and checks whether a divergence occurred on that same bar. If both line up, it triggers a separate "Bullish Confluence" or "Bearish Confluence" alert — the idea being that a volatility expansion plus a divergence in the same direction is a stronger combined signal than either alone.
Alerts are set up for every divergence type, for squeeze release on its own, and for the two confluence cases, so you can build alerts off whichever combination matters to you.
오픈 소스 스크립트
트레이딩뷰의 진정한 정신에 따라, 이 스크립트의 작성자는 이를 오픈소스로 공개하여 트레이더들이 기능을 검토하고 검증할 수 있도록 했습니다. 작성자에게 찬사를 보냅니다! 이 코드는 무료로 사용할 수 있지만, 코드를 재게시하는 경우 하우스 룰이 적용된다는 점을 기억하세요.

면책사항
해당 정보와 게시물은 금융, 투자, 트레이딩 또는 기타 유형의 조언이나 권장 사항으로 간주되지 않으며, 트레이딩뷰에서 제공하거나 보증하는 것이 아닙니다. 자세한 내용은 이용 약관을 참조하세요.
오픈 소스 스크립트
트레이딩뷰의 진정한 정신에 따라, 이 스크립트의 작성자는 이를 오픈소스로 공개하여 트레이더들이 기능을 검토하고 검증할 수 있도록 했습니다. 작성자에게 찬사를 보냅니다! 이 코드는 무료로 사용할 수 있지만, 코드를 재게시하는 경우 하우스 룰이 적용된다는 점을 기억하세요.
면책사항
해당 정보와 게시물은 금융, 투자, 트레이딩 또는 기타 유형의 조언이나 권장 사항으로 간주되지 않으며, 트레이딩뷰에서 제공하거나 보증하는 것이 아닙니다. 자세한 내용은 이용 약관을 참조하세요.