PT HTF Regime - MTF Trend/Range Ribbons & Invalidation Levels
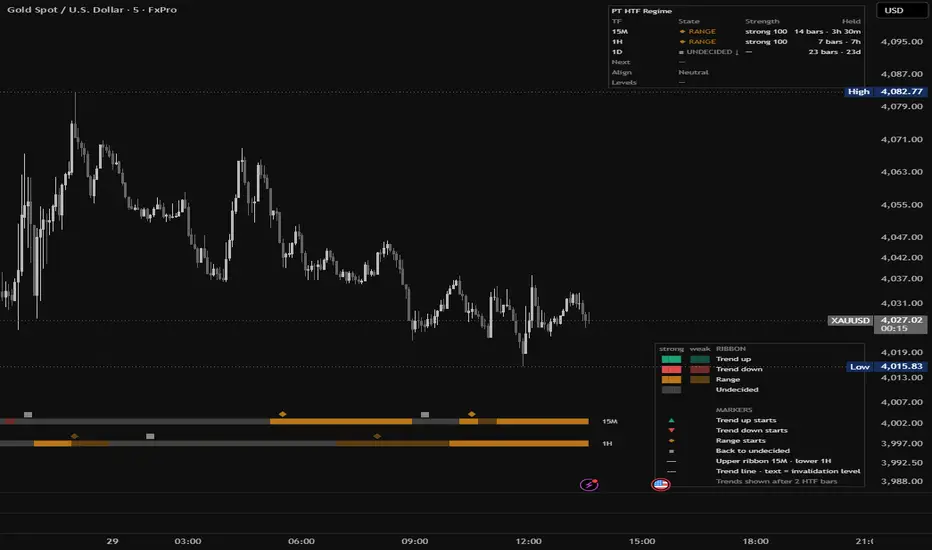
PT HTF Regime shows the market regime of two higher timeframes as thin ribbons at the bottom of your execution chart, so you can see the bigger picture without switching timeframes.
On a 5-minute chart you see the 15-minute and 1-hour regime; on a 15-minute chart, the 1-hour and 4-hour regime. Each regime is classified as TREND UP, TREND DOWN, RANGE or UNDECIDED, and every higher-timeframe trend carries its invalidation level: the price where that trend would end.
This is a context tool, not a signal generator. It tells you what the higher timeframes are doing and where that view breaks. Entries, stops and targets remain your own decisions.
HOW THE REGIME IS DECIDED
The engine runs on each higher timeframe and combines four independent measurements into one weighted vote:
• Efficiency Ratio (Kaufman): how direct the price path is.
• Choppiness Index (Dreiss): trending vs. sideways price action.
• ADX / DMI (Wilder): trend strength and directional balance.
• Hurst exponent (rescaled range, Anis–Lloyd / Peters corrected): whether moves tend to persist or revert.
Each measurement is scaled to a common trend-vs-range score. The weighted average decides between trend and range; the direction comes from the signed Efficiency Ratio and the DMI spread.
The raw vote is then passed through a state machine to keep labels stable:
• Hysteresis: a regime needs a stronger reading to start than to continue.
• Entry confirmation and a minimum hold, so single-bar noise does not flip the state.
• Structure exit: when a trend starts, the swing low (uptrend) or swing high (downtrend) just before it is stored. A close beyond that level ends the trend. This stored level is the invalidation level shown on the chart.
• Range shape: RANGE is only accepted when the recent range is wide enough and price sits near its middle. Narrow compression stays UNDECIDED.
Each regime is also rated strong or weak from a confidence score (vote strength × agreement between the measurements × clarity of direction).
NON-REPAINTING
All higher-timeframe values come from the last closed higher-timeframe bar (offset by one bar, requested with lookahead on). A 15-minute regime only changes after a 15-minute candle has closed, and once drawn, ribbons, markers, levels and alerts do not change.
The trade-off is a delay by design: a new 1-hour regime appears after the 1-hour bars that confirm it have closed.
READING THE CHART
Ribbons
• Upper ribbon = first higher timeframe (e.g. 15M), lower ribbon = second (e.g. 1H). Tags at the right end name them.
• Green = trend up, red = trend down, amber = range, grey = undecided.
• Solid shade = strong regime, lighter shade = weak regime.
Markers (above each ribbon)
• ▲ trend up starts · ▼ trend down starts · ◆ range starts · ■ back to undecided.
• By default a marker appears once the new regime has lasted 2 closed higher-timeframe bars, so one-bar blips get no marker.
Invalidation levels
• Each higher-timeframe trend gets text above its marker, e.g. "15M Downtrend @ 4062.84", and a dotted line for as long as the trend is shown.
• A close below the level ends an uptrend; a close above it ends a downtrend. The level is fixed when the trend starts and does not trail.
• Line and text are drawn for the last 30 days. For older trends, hover the marker to see the level.
• Nothing is drawn on the price area: all levels stay inside the ribbon block.
STATUS PANEL
Compact mode (default)
• One line per timeframe: state, strength and how long it has held (e.g. "▲ TREND UP · strong 72 · 3h").
• An alignment line: Aligned up / down, Lean up / down (one timeframe trending), Neutral, or Conflict (opposite trends).
Detailed mode adds
• Bars and time held per timeframe.
• Next: a regime change that is building but not yet confirmed.
• Levels: the current invalidation level of each trend.
Optional: a daily bias row (1D) for context. It is not part of the alignment or the alerts.
A legend explaining the colours and markers can be switched on separately.
ALERTS
• Aligned up: both higher timeframes in TREND UP, each past the marker delay.
• Aligned down: the same for TREND DOWN.
• Alignment lost: fires as soon as either timeframe leaves the aligned trend (exits are not delayed).
Set them up in either of two ways:
• Choose one of the three alert conditions, for a fixed message per alert, or
• Choose "Any alert() function call" for all three in one alert, with the real timeframe names in the message (e.g. "15M + 1H aligned TREND UP on XAUUSD").
All alerts use closed higher-timeframe bars only.
TIMEFRAMES
Auto mode picks one and two steps above the chart:
• 5M and lower → 15M + 1H
• 15M → 1H + 4H
• 1H → 4H + 1D
• 4H → 1D + 1W
• 1D → 1W + 1M
Manual mode lets you choose both timeframes. A timeframe that is not above the chart shows as "off".
SETTINGS
• Asset preset: Auto, Gold or Crypto. Crypto uses slightly lower trend thresholds; Auto picks it from the symbol type.
• Responsiveness: Balanced (default), Fast (reacts sooner, more changes) or Standard (slower, steadier).
• Ribbon block height, timeframe tags, markers and their delay, invalidation levels, colours.
• Status panel on/off, position and mode; legend on/off and position; text size.
Built and tested on gold (XAUUSD) and crypto on 5M and 15M charts. It works on any symbol and timeframe, but the presets are tuned for these markets.
NOTES
• The regime labels describe the past higher-timeframe bars; they do not predict the next move. A trend label can end on the next close.
• Use it as context alongside your own analysis and risk management.
• This script is for educational and informational purposes only and is not financial advice.
On a 5-minute chart you see the 15-minute and 1-hour regime; on a 15-minute chart, the 1-hour and 4-hour regime. Each regime is classified as TREND UP, TREND DOWN, RANGE or UNDECIDED, and every higher-timeframe trend carries its invalidation level: the price where that trend would end.
This is a context tool, not a signal generator. It tells you what the higher timeframes are doing and where that view breaks. Entries, stops and targets remain your own decisions.
HOW THE REGIME IS DECIDED
The engine runs on each higher timeframe and combines four independent measurements into one weighted vote:
• Efficiency Ratio (Kaufman): how direct the price path is.
• Choppiness Index (Dreiss): trending vs. sideways price action.
• ADX / DMI (Wilder): trend strength and directional balance.
• Hurst exponent (rescaled range, Anis–Lloyd / Peters corrected): whether moves tend to persist or revert.
Each measurement is scaled to a common trend-vs-range score. The weighted average decides between trend and range; the direction comes from the signed Efficiency Ratio and the DMI spread.
The raw vote is then passed through a state machine to keep labels stable:
• Hysteresis: a regime needs a stronger reading to start than to continue.
• Entry confirmation and a minimum hold, so single-bar noise does not flip the state.
• Structure exit: when a trend starts, the swing low (uptrend) or swing high (downtrend) just before it is stored. A close beyond that level ends the trend. This stored level is the invalidation level shown on the chart.
• Range shape: RANGE is only accepted when the recent range is wide enough and price sits near its middle. Narrow compression stays UNDECIDED.
Each regime is also rated strong or weak from a confidence score (vote strength × agreement between the measurements × clarity of direction).
NON-REPAINTING
All higher-timeframe values come from the last closed higher-timeframe bar (offset by one bar, requested with lookahead on). A 15-minute regime only changes after a 15-minute candle has closed, and once drawn, ribbons, markers, levels and alerts do not change.
The trade-off is a delay by design: a new 1-hour regime appears after the 1-hour bars that confirm it have closed.
READING THE CHART
Ribbons
• Upper ribbon = first higher timeframe (e.g. 15M), lower ribbon = second (e.g. 1H). Tags at the right end name them.
• Green = trend up, red = trend down, amber = range, grey = undecided.
• Solid shade = strong regime, lighter shade = weak regime.
Markers (above each ribbon)
• ▲ trend up starts · ▼ trend down starts · ◆ range starts · ■ back to undecided.
• By default a marker appears once the new regime has lasted 2 closed higher-timeframe bars, so one-bar blips get no marker.
Invalidation levels
• Each higher-timeframe trend gets text above its marker, e.g. "15M Downtrend @ 4062.84", and a dotted line for as long as the trend is shown.
• A close below the level ends an uptrend; a close above it ends a downtrend. The level is fixed when the trend starts and does not trail.
• Line and text are drawn for the last 30 days. For older trends, hover the marker to see the level.
• Nothing is drawn on the price area: all levels stay inside the ribbon block.
STATUS PANEL
Compact mode (default)
• One line per timeframe: state, strength and how long it has held (e.g. "▲ TREND UP · strong 72 · 3h").
• An alignment line: Aligned up / down, Lean up / down (one timeframe trending), Neutral, or Conflict (opposite trends).
Detailed mode adds
• Bars and time held per timeframe.
• Next: a regime change that is building but not yet confirmed.
• Levels: the current invalidation level of each trend.
Optional: a daily bias row (1D) for context. It is not part of the alignment or the alerts.
A legend explaining the colours and markers can be switched on separately.
ALERTS
• Aligned up: both higher timeframes in TREND UP, each past the marker delay.
• Aligned down: the same for TREND DOWN.
• Alignment lost: fires as soon as either timeframe leaves the aligned trend (exits are not delayed).
Set them up in either of two ways:
• Choose one of the three alert conditions, for a fixed message per alert, or
• Choose "Any alert() function call" for all three in one alert, with the real timeframe names in the message (e.g. "15M + 1H aligned TREND UP on XAUUSD").
All alerts use closed higher-timeframe bars only.
TIMEFRAMES
Auto mode picks one and two steps above the chart:
• 5M and lower → 15M + 1H
• 15M → 1H + 4H
• 1H → 4H + 1D
• 4H → 1D + 1W
• 1D → 1W + 1M
Manual mode lets you choose both timeframes. A timeframe that is not above the chart shows as "off".
SETTINGS
• Asset preset: Auto, Gold or Crypto. Crypto uses slightly lower trend thresholds; Auto picks it from the symbol type.
• Responsiveness: Balanced (default), Fast (reacts sooner, more changes) or Standard (slower, steadier).
• Ribbon block height, timeframe tags, markers and their delay, invalidation levels, colours.
• Status panel on/off, position and mode; legend on/off and position; text size.
Built and tested on gold (XAUUSD) and crypto on 5M and 15M charts. It works on any symbol and timeframe, but the presets are tuned for these markets.
NOTES
• The regime labels describe the past higher-timeframe bars; they do not predict the next move. A trend label can end on the next close.
• Use it as context alongside your own analysis and risk management.
• This script is for educational and informational purposes only and is not financial advice.

면책사항
해당 정보와 게시물은 금융, 투자, 트레이딩 또는 기타 유형의 조언이나 권장 사항으로 간주되지 않으며, 트레이딩뷰에서 제공하거나 보증하는 것이 아닙니다. 자세한 내용은 이용 약관을 참조하세요.
면책사항
해당 정보와 게시물은 금융, 투자, 트레이딩 또는 기타 유형의 조언이나 권장 사항으로 간주되지 않으며, 트레이딩뷰에서 제공하거나 보증하는 것이 아닙니다. 자세한 내용은 이용 약관을 참조하세요.