Reversal Hammer, Star Breakout v1
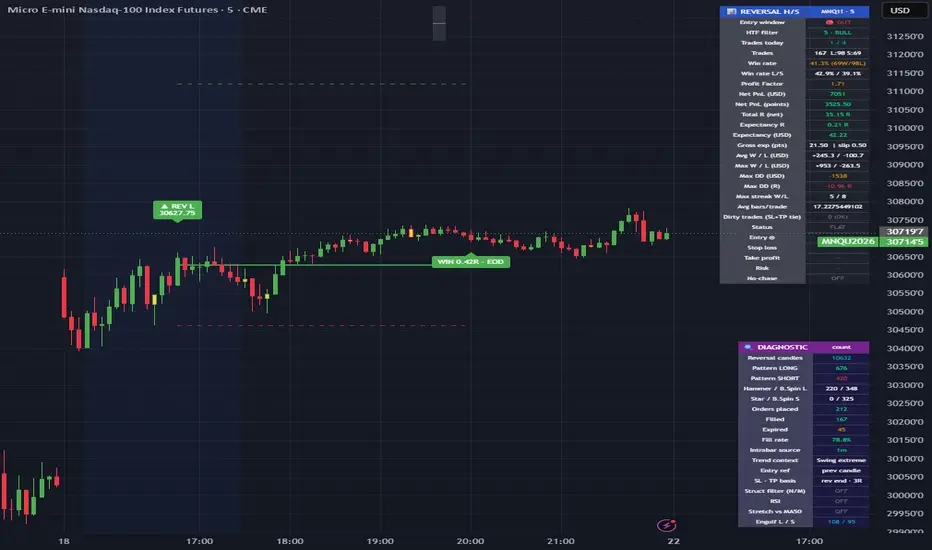
Reversal Hammer/Star Breakout is a candlestick-reversal breakout tool with a built-in trade-simulation and statistics engine. It detects exhaustion candles at the end of a move, arms a stop-entry on the breakout of a reference level, manages the resulting position with a fixed stop and a configurable target, and then logs and scores every trade in a self-contained performance dashboard — all from a single indicator, without a separate strategy script.
The goal is not to display a pattern and leave the rest to the eye. Every detected setup is turned into a fully specified order (entry, stop, target), filled or expired according to explicit rules, resolved intrabar for stop/target precision, and recorded with realistic costs. What you see on the dashboard is therefore an internal back-of-the-envelope simulation of how that exact rule set would have behaved on the loaded symbol and timeframe.
The setup
Long (bottom reversal). At the end of a down move the script looks for a bullish reversal candle — a Hammer, a Bullish Spinning Top, or (optionally) a Bullish Engulfing candle. When one prints in a valid context, a buy stop is armed above a reference level. The protective stop is placed at the low of the reversal candle.
Short (top reversal). At the end of an up move it looks for a bearish reversal candle — a Shooting Star / Inverted Hammer, a Bearish Spinning Top, or (optionally) a Bearish Engulfing candle. A sell stop is armed below a reference level, with the protective stop at the high of the reversal candle.
Entry reference. The breakout level is configurable:
Candle before reversal — break of the high (long) / low (short) of the candle that precedes the reversal candle. More confirmation, later entry.
Reversal candle — break of the reversal candle's own high/low. Earlier, tighter entry.
Stop. Opposite extreme of the reversal candle (with an optional tick buffer), or a fixed tick distance from entry.
Target. A configurable R multiple of the entry-to-stop risk (default), or the reversal candle range.
Pattern definition (fully adjustable)
Candle shapes are defined by ratios rather than fixed thresholds, so they adapt to any instrument:
Max body size as a fraction of the candle range.
Minimum dominant wick, expressed both as a multiple of the body and as a fraction of the range (the latter keeps doji-like candles honest).
Maximum opposite wick as a multiple of the body.
Spinning-top minimum wick on each side.
You can independently enable Hammer, Bullish/Bearish Spinning Top, Shooting Star / Inverted Hammer and Bullish/Bearish Engulfing, and optionally require the reversal candle to close in the trade direction. Lowering the dominant-wick multiple below 1.0 lets you accept larger-bodied hammers/stars; engulfing covers strong-bodied reversals that have little or no wick.
Filters
Each filter is optional and independent, so you can isolate exactly what adds value:
Trend context. Confirms the reversal occurs at the end of a trend. EMA trend (price beyond a sloping EMA) or Swing extreme (the reversal candle prints a fresh N-bar low/high), or either, or off.
Higher-timeframe filter. A fast/slow EMA relationship on a higher timeframe. It can require the higher timeframe to agree with the trade direction (confluence) or to still agree with the prior trend (early-reversal). It is read from confirmed higher-timeframe values with a one-bar offset and no look-ahead, so it does not repaint.
Breakout structure. Requires the entry to clear the extreme of the last N bars while excluding the most recent M bars. In a clean trend each bar prints a fresh extreme; taking the reference from the older window prevents the level from being redefined every bar, which curbs cascade entries.
RSI extreme. Longs only when RSI is oversold, shorts only when overbought, with adjustable thresholds and length.
Distance from a moving average. Requires price to be stretched at least k daily-ATR units away from a moving average (SMA/EMA, adjustable length) — below it for longs, above it for shorts — to favour genuine exhaustion. The reference average is plotted on the chart.
Simulation engine and no-repaint design
Bar-close-only processing. Setups, fills and exits can be evaluated only when a bar closes, so the historical and the real-time picture match.
Intrabar resolution cascade. Stop-entry fills and stop/target hits are resolved by walking sub-candles in chronological order, cascading 1-minute → 2-minute → 5-minute and falling back to the bar OHLC when sub-candle data is unavailable. The active source is shown in the diagnostic panel.
Tie handling and dirty bars. When a single bar would touch both the stop and the target, the order is ambiguous; the outcome is resolved by a conservative (stop-first) or optimistic (target-first) rule, and the trade is flagged as a dirty bar and counted separately so you can judge how much of the result is path-dependent.
Realistic costs. Per-side slippage in ticks is applied to every fill, and instrument tick size / tick value / contract size can be read automatically or set manually, so currency results match the traded product.
Trade management
One trade at a time, with an optional cooldown after each close.
Maximum bars in trade (time stop) and an optional force-flat window at the end of the session.
Entry time window and maximum trades per day, with a selectable session timezone.
Optional post-win no-chase cooldown that blocks new same-direction entries priced worse than the last winner's exit for a number of bars, to avoid chasing a move you just profited from.
Statistics dashboard
A compact panel reports, in points, currency and R: number of trades and long/short split, win rate (overall and per side), profit factor, net result, expectancy in R and in currency, average and largest win/loss, maximum drawdown in currency and in R, maximum win/loss streaks, average bars per trade, dirty-trade share, and the live status of any open or pending order (direction, entry, stop, target, risk).
Diagnostic panel
A second panel makes it easy to understand why a setup did or did not trade: counts of reversal candles, qualified long/short patterns, pattern types (hammer, spinning top, engulfing), orders placed, filled and expired, fill rate, the active intrabar source, and the current state of every filter (trend context, structure, RSI value, stretch distance in ATR units). If a candle you expected to trigger does not, these counters localise the cause immediately.
Visuals, logs and alerts
The reversal candle is highlighted, with optional projected entry/stop/target lines and small entry/exit labels.
An open-position banner shows live PnL in currency, points and R.
Every closed trade is printed to Pine Logs as a single CSV line (with a header row), so the full trade list can be exported and analysed externally.
Alerts are available for a detected long/short reversal and for a stop-entry order being placed.
Suggested workflow
Set the instrument tick size, tick value, contract size and slippage to match your product.
Start with the pattern set and entry/stop/target rules only, all filters off, and read the dashboard.
Enable one filter at a time and compare the dashboard before and after, so each filter has to justify its inclusion rather than being added on faith.
Use the diagnostic panel whenever an expected signal is missing.
Treat dirty-bar share and slippage-adjusted expectancy as quality gates before trusting the numbers.
Notes on realism
The dashboard is an internal simulation, not the native Strategy Tester, and it is deliberately built to err toward conservative, realistic results: bar-close processing, intrabar ordering for stop/target, explicit dirty-bar accounting, modelled slippage and instrument-accurate currency. Results still depend on the loaded symbol, timeframe and the availability of sub-minute data for the intrabar cascade. Widening pattern definitions or relaxing filters to capture a specific past setup is a classic route to overfitting; after any such change, re-evaluate the aggregate statistics rather than a single trade.
Disclaimer
This script is published for educational and research purposes only. It is not financial advice and not a recommendation to buy or sell any instrument. Backtested and simulated results do not guarantee future performance. Trading futures and leveraged products involves substantial risk of loss. Always test on your own data and trade only with capital you can afford to lose.
The goal is not to display a pattern and leave the rest to the eye. Every detected setup is turned into a fully specified order (entry, stop, target), filled or expired according to explicit rules, resolved intrabar for stop/target precision, and recorded with realistic costs. What you see on the dashboard is therefore an internal back-of-the-envelope simulation of how that exact rule set would have behaved on the loaded symbol and timeframe.
The setup
Long (bottom reversal). At the end of a down move the script looks for a bullish reversal candle — a Hammer, a Bullish Spinning Top, or (optionally) a Bullish Engulfing candle. When one prints in a valid context, a buy stop is armed above a reference level. The protective stop is placed at the low of the reversal candle.
Short (top reversal). At the end of an up move it looks for a bearish reversal candle — a Shooting Star / Inverted Hammer, a Bearish Spinning Top, or (optionally) a Bearish Engulfing candle. A sell stop is armed below a reference level, with the protective stop at the high of the reversal candle.
Entry reference. The breakout level is configurable:
Candle before reversal — break of the high (long) / low (short) of the candle that precedes the reversal candle. More confirmation, later entry.
Reversal candle — break of the reversal candle's own high/low. Earlier, tighter entry.
Stop. Opposite extreme of the reversal candle (with an optional tick buffer), or a fixed tick distance from entry.
Target. A configurable R multiple of the entry-to-stop risk (default), or the reversal candle range.
Pattern definition (fully adjustable)
Candle shapes are defined by ratios rather than fixed thresholds, so they adapt to any instrument:
Max body size as a fraction of the candle range.
Minimum dominant wick, expressed both as a multiple of the body and as a fraction of the range (the latter keeps doji-like candles honest).
Maximum opposite wick as a multiple of the body.
Spinning-top minimum wick on each side.
You can independently enable Hammer, Bullish/Bearish Spinning Top, Shooting Star / Inverted Hammer and Bullish/Bearish Engulfing, and optionally require the reversal candle to close in the trade direction. Lowering the dominant-wick multiple below 1.0 lets you accept larger-bodied hammers/stars; engulfing covers strong-bodied reversals that have little or no wick.
Filters
Each filter is optional and independent, so you can isolate exactly what adds value:
Trend context. Confirms the reversal occurs at the end of a trend. EMA trend (price beyond a sloping EMA) or Swing extreme (the reversal candle prints a fresh N-bar low/high), or either, or off.
Higher-timeframe filter. A fast/slow EMA relationship on a higher timeframe. It can require the higher timeframe to agree with the trade direction (confluence) or to still agree with the prior trend (early-reversal). It is read from confirmed higher-timeframe values with a one-bar offset and no look-ahead, so it does not repaint.
Breakout structure. Requires the entry to clear the extreme of the last N bars while excluding the most recent M bars. In a clean trend each bar prints a fresh extreme; taking the reference from the older window prevents the level from being redefined every bar, which curbs cascade entries.
RSI extreme. Longs only when RSI is oversold, shorts only when overbought, with adjustable thresholds and length.
Distance from a moving average. Requires price to be stretched at least k daily-ATR units away from a moving average (SMA/EMA, adjustable length) — below it for longs, above it for shorts — to favour genuine exhaustion. The reference average is plotted on the chart.
Simulation engine and no-repaint design
Bar-close-only processing. Setups, fills and exits can be evaluated only when a bar closes, so the historical and the real-time picture match.
Intrabar resolution cascade. Stop-entry fills and stop/target hits are resolved by walking sub-candles in chronological order, cascading 1-minute → 2-minute → 5-minute and falling back to the bar OHLC when sub-candle data is unavailable. The active source is shown in the diagnostic panel.
Tie handling and dirty bars. When a single bar would touch both the stop and the target, the order is ambiguous; the outcome is resolved by a conservative (stop-first) or optimistic (target-first) rule, and the trade is flagged as a dirty bar and counted separately so you can judge how much of the result is path-dependent.
Realistic costs. Per-side slippage in ticks is applied to every fill, and instrument tick size / tick value / contract size can be read automatically or set manually, so currency results match the traded product.
Trade management
One trade at a time, with an optional cooldown after each close.
Maximum bars in trade (time stop) and an optional force-flat window at the end of the session.
Entry time window and maximum trades per day, with a selectable session timezone.
Optional post-win no-chase cooldown that blocks new same-direction entries priced worse than the last winner's exit for a number of bars, to avoid chasing a move you just profited from.
Statistics dashboard
A compact panel reports, in points, currency and R: number of trades and long/short split, win rate (overall and per side), profit factor, net result, expectancy in R and in currency, average and largest win/loss, maximum drawdown in currency and in R, maximum win/loss streaks, average bars per trade, dirty-trade share, and the live status of any open or pending order (direction, entry, stop, target, risk).
Diagnostic panel
A second panel makes it easy to understand why a setup did or did not trade: counts of reversal candles, qualified long/short patterns, pattern types (hammer, spinning top, engulfing), orders placed, filled and expired, fill rate, the active intrabar source, and the current state of every filter (trend context, structure, RSI value, stretch distance in ATR units). If a candle you expected to trigger does not, these counters localise the cause immediately.
Visuals, logs and alerts
The reversal candle is highlighted, with optional projected entry/stop/target lines and small entry/exit labels.
An open-position banner shows live PnL in currency, points and R.
Every closed trade is printed to Pine Logs as a single CSV line (with a header row), so the full trade list can be exported and analysed externally.
Alerts are available for a detected long/short reversal and for a stop-entry order being placed.
Suggested workflow
Set the instrument tick size, tick value, contract size and slippage to match your product.
Start with the pattern set and entry/stop/target rules only, all filters off, and read the dashboard.
Enable one filter at a time and compare the dashboard before and after, so each filter has to justify its inclusion rather than being added on faith.
Use the diagnostic panel whenever an expected signal is missing.
Treat dirty-bar share and slippage-adjusted expectancy as quality gates before trusting the numbers.
Notes on realism
The dashboard is an internal simulation, not the native Strategy Tester, and it is deliberately built to err toward conservative, realistic results: bar-close processing, intrabar ordering for stop/target, explicit dirty-bar accounting, modelled slippage and instrument-accurate currency. Results still depend on the loaded symbol, timeframe and the availability of sub-minute data for the intrabar cascade. Widening pattern definitions or relaxing filters to capture a specific past setup is a classic route to overfitting; after any such change, re-evaluate the aggregate statistics rather than a single trade.
Disclaimer
This script is published for educational and research purposes only. It is not financial advice and not a recommendation to buy or sell any instrument. Backtested and simulated results do not guarantee future performance. Trading futures and leveraged products involves substantial risk of loss. Always test on your own data and trade only with capital you can afford to lose.

면책사항
해당 정보와 게시물은 금융, 투자, 트레이딩 또는 기타 유형의 조언이나 권장 사항으로 간주되지 않으며, 트레이딩뷰에서 제공하거나 보증하는 것이 아닙니다. 자세한 내용은 이용 약관을 참조하세요.
면책사항
해당 정보와 게시물은 금융, 투자, 트레이딩 또는 기타 유형의 조언이나 권장 사항으로 간주되지 않으며, 트레이딩뷰에서 제공하거나 보증하는 것이 아닙니다. 자세한 내용은 이용 약관을 참조하세요.