Ratio Range Bands 20D HH/LL
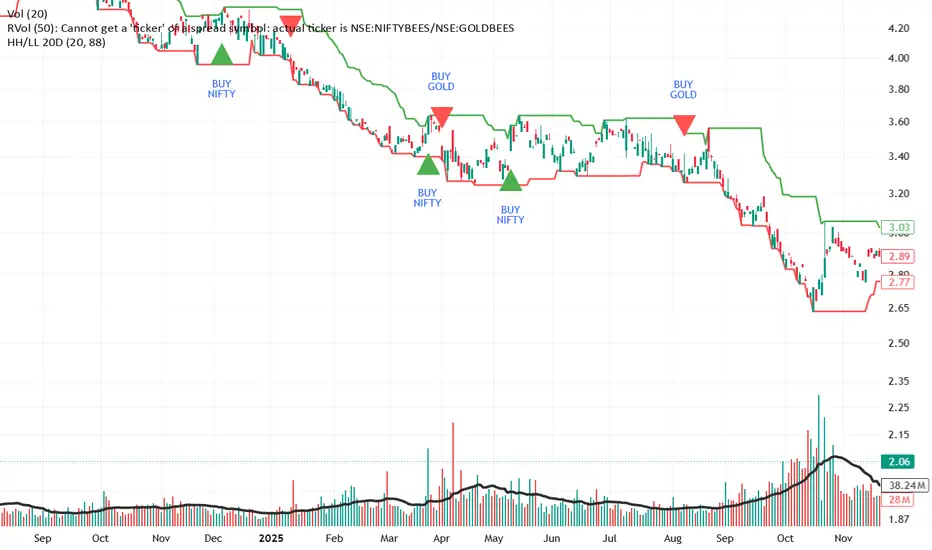
A momentum-based rotation indicator designed for the NIFTYBEES/GOLDBEES
ratio chart (Daily timeframe). It tracks the 20-day Highest High and
Lowest Low to generate clean, non-repeating buy/rotate signals.
─── HOW IT WORKS ───────────────────────────────────────────
When the ratio closes ABOVE the 20-day Highest High:
→ BUY NIFTYBEES (equities outperforming gold)
When the ratio closes BELOW the 20-day Lowest Low:
→ SELL NIFTYBEES and BUY GOLDBEES (gold outperforming equities)
─── SIGNAL FILTER (STATE MACHINE) ──────────────────────────
The indicator tracks your current position state:
● IN NIFTYBEES — will only signal next when rotation to Gold triggers
● IN GOLDBEES — will only signal next when rotation to Nifty triggers
● NEUTRAL — fresh start, responds to whichever breaks first
This prevents duplicate signals — once you are in a position,
the same signal will NOT fire again until the opposite one triggers.
─── VISUAL FEATURES ────────────────────────
ratio chart (Daily timeframe). It tracks the 20-day Highest High and
Lowest Low to generate clean, non-repeating buy/rotate signals.
─── HOW IT WORKS ───────────────────────────────────────────
When the ratio closes ABOVE the 20-day Highest High:
→ BUY NIFTYBEES (equities outperforming gold)
When the ratio closes BELOW the 20-day Lowest Low:
→ SELL NIFTYBEES and BUY GOLDBEES (gold outperforming equities)
─── SIGNAL FILTER (STATE MACHINE) ──────────────────────────
The indicator tracks your current position state:
● IN NIFTYBEES — will only signal next when rotation to Gold triggers
● IN GOLDBEES — will only signal next when rotation to Nifty triggers
● NEUTRAL — fresh start, responds to whichever breaks first
This prevents duplicate signals — once you are in a position,
the same signal will NOT fire again until the opposite one triggers.
─── VISUAL FEATURES ────────────────────────

면책사항
해당 정보와 게시물은 금융, 투자, 트레이딩 또는 기타 유형의 조언이나 권장 사항으로 간주되지 않으며, 트레이딩뷰에서 제공하거나 보증하는 것이 아닙니다. 자세한 내용은 이용 약관을 참조하세요.
면책사항
해당 정보와 게시물은 금융, 투자, 트레이딩 또는 기타 유형의 조언이나 권장 사항으로 간주되지 않으며, 트레이딩뷰에서 제공하거나 보증하는 것이 아닙니다. 자세한 내용은 이용 약관을 참조하세요.