Satish Goyani 10Min Gap/Move Strategy
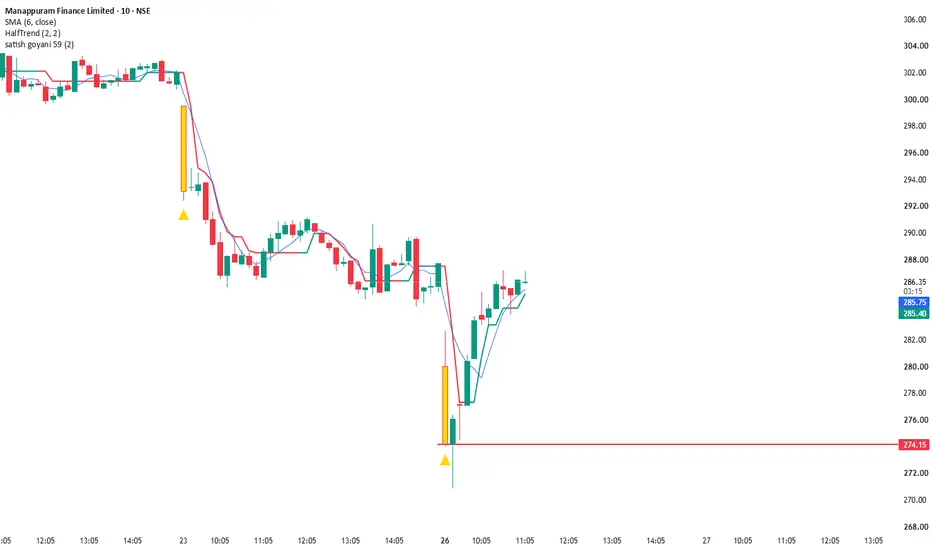
This indicator identifies high-momentum opening moves on the 10-minute timeframe based on the previous day's close.
### How it Works:
1. **Timeframe:** Optimized specifically for the **10-minute (10m)** chart.
2. **Condition:** It calculates the percentage difference between the **Previous Day's Close** and the **First 10-minute candle's close** of the current day.
3. **Target:** If the absolute price movement meets or exceeds the user-defined percentage (Default: **2.0%**), it triggers a signal.
4. **Visuals:**
- Highlights the qualifying first 10-minute candle in **Gold** color.
- Plots a **Gold Arrow** below the candle for quick visual identification.
### Inputs:
* **Target Percentage (%)**: Adjustable threshold for the minimum price move required (Default is 2.0%).
*Note: This script is intended for educational and analytical purposes on 10-minute intraday charts.*
### How it Works:
1. **Timeframe:** Optimized specifically for the **10-minute (10m)** chart.
2. **Condition:** It calculates the percentage difference between the **Previous Day's Close** and the **First 10-minute candle's close** of the current day.
3. **Target:** If the absolute price movement meets or exceeds the user-defined percentage (Default: **2.0%**), it triggers a signal.
4. **Visuals:**
- Highlights the qualifying first 10-minute candle in **Gold** color.
- Plots a **Gold Arrow** below the candle for quick visual identification.
### Inputs:
* **Target Percentage (%)**: Adjustable threshold for the minimum price move required (Default is 2.0%).
*Note: This script is intended for educational and analytical purposes on 10-minute intraday charts.*

면책사항
해당 정보와 게시물은 금융, 투자, 트레이딩 또는 기타 유형의 조언이나 권장 사항으로 간주되지 않으며, 트레이딩뷰에서 제공하거나 보증하는 것이 아닙니다. 자세한 내용은 이용 약관을 참조하세요.
면책사항
해당 정보와 게시물은 금융, 투자, 트레이딩 또는 기타 유형의 조언이나 권장 사항으로 간주되지 않으며, 트레이딩뷰에서 제공하거나 보증하는 것이 아닙니다. 자세한 내용은 이용 약관을 참조하세요.