OPEN-SOURCE SCRIPT
업데이트됨 Consecutive Candle Probability by YCGH Capital
Overview
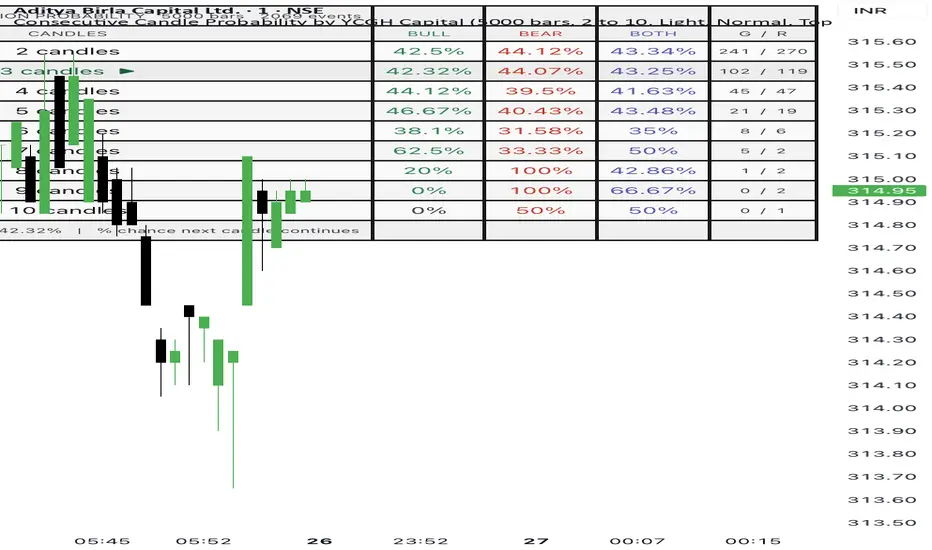
The Consecutive Candle Probability indicator is designed to analyze how often price forms continuous streaks of bullish or bearish candles over a selected lookback period. It scans historical data to identify exact sequences of consecutive green or red candles and calculates their occurrence frequency as a percentage of all detected streak events. The output is presented in a structured table, allowing traders to quickly understand the behavioral tendencies of an asset, whether it favors continuation or frequent reversals.
Concept and Logic
The core logic of the indicator is based on identifying “exact streaks,” meaning a sequence of candles that is strictly bounded on both sides. A bullish streak is counted only if a defined number of consecutive green candles occurs, and the candles immediately before and after the sequence are not green. The same logic applies to bearish streaks. This ensures that longer streaks are not double-counted as smaller ones and that each event represents a clean and independent occurrence in the dataset.
Probability Calculation
For each streak length within the selected range, the indicator counts how many times bullish and bearish streaks occur and then normalizes these counts against the total number of all detected streak events. The result is expressed as a percentage, providing a relative probability distribution rather than raw counts. This allows traders to compare different streak lengths and quickly identify which patterns are statistically more common in the chosen market and timeframe.
Current Market Context
In addition to historical probabilities, the indicator tracks the current live streak on the chart. It determines whether the market is currently in a bullish or bearish sequence and highlights the corresponding row in the table. This contextual layer helps traders immediately relate real-time price action to historical tendencies, offering a perspective on whether the current streak is typical or extended relative to past behavior.
Table Structure and Visualization
The output is displayed in a dynamically generated table that adapts based on user preferences. It includes columns for bullish probability, bearish probability, combined probability, and raw counts of occurrences. The layout is designed to be clean and readable, with alternating row backgrounds and theme-aware colors to ensure clarity in both light and dark chart environments. The table also includes a title section summarizing the lookback period and total number of streak events analyzed.
Customization Options
The indicator provides several configurable inputs to tailor the analysis to different trading styles. Users can select the lookback period to control how much historical data is analyzed, define the maximum streak length to focus on shorter or longer sequences, and toggle the visibility of bullish, bearish, or combined probability columns. Additional options allow adjustment of the table position and text size, ensuring compatibility with different chart layouts and personal preferences.
Use Cases in Trading
This indicator is particularly useful for understanding market structure and behavioral tendencies. Traders can use it to assess whether an asset tends to trend in extended runs or revert quickly after short moves. It can support decision-making in strategies such as momentum trading, mean reversion, or scalping by providing statistical context to streak-based setups. While it does not generate direct buy or sell signals, it acts as a probabilistic tool to improve confidence and filtering in existing trading systems.
Limitations and Considerations
The probabilities produced by the indicator are entirely based on historical data and do not guarantee future outcomes. Market conditions can change over time, and patterns that were previously common may lose relevance. The results are also sensitive to the selected timeframe and lookback window, which means traders should test different configurations to understand how the behavior varies across conditions. This tool should be used as a supplementary layer of analysis rather than a standalone decision-making system.
The Consecutive Candle Probability indicator is designed to analyze how often price forms continuous streaks of bullish or bearish candles over a selected lookback period. It scans historical data to identify exact sequences of consecutive green or red candles and calculates their occurrence frequency as a percentage of all detected streak events. The output is presented in a structured table, allowing traders to quickly understand the behavioral tendencies of an asset, whether it favors continuation or frequent reversals.
Concept and Logic
The core logic of the indicator is based on identifying “exact streaks,” meaning a sequence of candles that is strictly bounded on both sides. A bullish streak is counted only if a defined number of consecutive green candles occurs, and the candles immediately before and after the sequence are not green. The same logic applies to bearish streaks. This ensures that longer streaks are not double-counted as smaller ones and that each event represents a clean and independent occurrence in the dataset.
Probability Calculation
For each streak length within the selected range, the indicator counts how many times bullish and bearish streaks occur and then normalizes these counts against the total number of all detected streak events. The result is expressed as a percentage, providing a relative probability distribution rather than raw counts. This allows traders to compare different streak lengths and quickly identify which patterns are statistically more common in the chosen market and timeframe.
Current Market Context
In addition to historical probabilities, the indicator tracks the current live streak on the chart. It determines whether the market is currently in a bullish or bearish sequence and highlights the corresponding row in the table. This contextual layer helps traders immediately relate real-time price action to historical tendencies, offering a perspective on whether the current streak is typical or extended relative to past behavior.
Table Structure and Visualization
The output is displayed in a dynamically generated table that adapts based on user preferences. It includes columns for bullish probability, bearish probability, combined probability, and raw counts of occurrences. The layout is designed to be clean and readable, with alternating row backgrounds and theme-aware colors to ensure clarity in both light and dark chart environments. The table also includes a title section summarizing the lookback period and total number of streak events analyzed.
Customization Options
The indicator provides several configurable inputs to tailor the analysis to different trading styles. Users can select the lookback period to control how much historical data is analyzed, define the maximum streak length to focus on shorter or longer sequences, and toggle the visibility of bullish, bearish, or combined probability columns. Additional options allow adjustment of the table position and text size, ensuring compatibility with different chart layouts and personal preferences.
Use Cases in Trading
This indicator is particularly useful for understanding market structure and behavioral tendencies. Traders can use it to assess whether an asset tends to trend in extended runs or revert quickly after short moves. It can support decision-making in strategies such as momentum trading, mean reversion, or scalping by providing statistical context to streak-based setups. While it does not generate direct buy or sell signals, it acts as a probabilistic tool to improve confidence and filtering in existing trading systems.
Limitations and Considerations
The probabilities produced by the indicator are entirely based on historical data and do not guarantee future outcomes. Market conditions can change over time, and patterns that were previously common may lose relevance. The results are also sensitive to the selected timeframe and lookback window, which means traders should test different configurations to understand how the behavior varies across conditions. This tool should be used as a supplementary layer of analysis rather than a standalone decision-making system.
릴리즈 노트
logic updated오픈 소스 스크립트
트레이딩뷰의 진정한 정신에 따라, 이 스크립트의 작성자는 이를 오픈소스로 공개하여 트레이더들이 기능을 검토하고 검증할 수 있도록 했습니다. 작성자에게 찬사를 보냅니다! 이 코드는 무료로 사용할 수 있지만, 코드를 재게시하는 경우 하우스 룰이 적용된다는 점을 기억하세요.

For Daily LIVE Trades
Join FREE Telegram:t.me/+xavhcozoJexhZTVl
Join FREE Telegram:t.me/+xavhcozoJexhZTVl
면책사항
해당 정보와 게시물은 금융, 투자, 트레이딩 또는 기타 유형의 조언이나 권장 사항으로 간주되지 않으며, 트레이딩뷰에서 제공하거나 보증하는 것이 아닙니다. 자세한 내용은 이용 약관을 참조하세요.
오픈 소스 스크립트
트레이딩뷰의 진정한 정신에 따라, 이 스크립트의 작성자는 이를 오픈소스로 공개하여 트레이더들이 기능을 검토하고 검증할 수 있도록 했습니다. 작성자에게 찬사를 보냅니다! 이 코드는 무료로 사용할 수 있지만, 코드를 재게시하는 경우 하우스 룰이 적용된다는 점을 기억하세요.
For Daily LIVE Trades
Join FREE Telegram:t.me/+xavhcozoJexhZTVl
Join FREE Telegram:t.me/+xavhcozoJexhZTVl
면책사항
해당 정보와 게시물은 금융, 투자, 트레이딩 또는 기타 유형의 조언이나 권장 사항으로 간주되지 않으며, 트레이딩뷰에서 제공하거나 보증하는 것이 아닙니다. 자세한 내용은 이용 약관을 참조하세요.