업데이트됨
CHT 3 Consecutive Candles
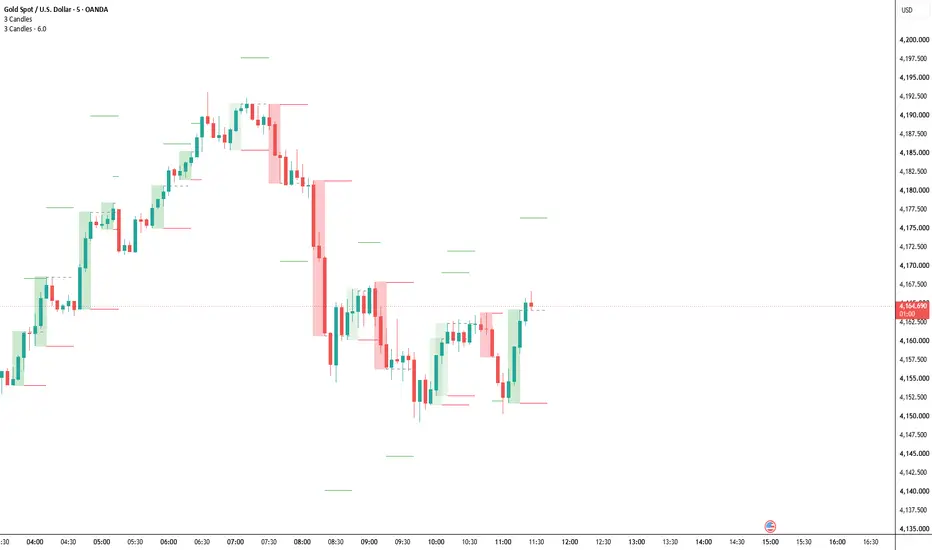
This indicator spots when a set number of bullish or bearish candles form in a row, and marks it directly on your chart with a coloured box and a label.
How it works
A candle counts as bullish if it closes above its open, and bearish if it closes below its open. When the chosen number of same-direction candles appear back to back (3 by default), the indicator draws a box around the whole run. Green means a bullish run and red means a bearish run. A label at the edge of the box shows the candle count and direction (3▲ or 3▼). A doji, where the open and close are equal, counts as neither and breaks the run.
How it works
A candle counts as bullish if it closes above its open, and bearish if it closes below its open. When the chosen number of same-direction candles appear back to back (3 by default), the indicator draws a box around the whole run. Green means a bullish run and red means a bearish run. A label at the edge of the box shows the candle count and direction (3▲ or 3▼). A doji, where the open and close are equal, counts as neither and breaks the run.
릴리즈 노트
now the sl is at the top bottom of the box when before it would just be at the high/low of the 1st candle stick 릴리즈 노트
now there is a toggle option to see higher probiblity setups 
면책사항
해당 정보와 게시물은 금융, 투자, 트레이딩 또는 기타 유형의 조언이나 권장 사항으로 간주되지 않으며, 트레이딩뷰에서 제공하거나 보증하는 것이 아닙니다. 자세한 내용은 이용 약관을 참조하세요.
면책사항
해당 정보와 게시물은 금융, 투자, 트레이딩 또는 기타 유형의 조언이나 권장 사항으로 간주되지 않으며, 트레이딩뷰에서 제공하거나 보증하는 것이 아닙니다. 자세한 내용은 이용 약관을 참조하세요.