OPEN-SOURCE SCRIPT
Weekly 30 SMA + 30 EMA Ribbon + Spread SD
Description
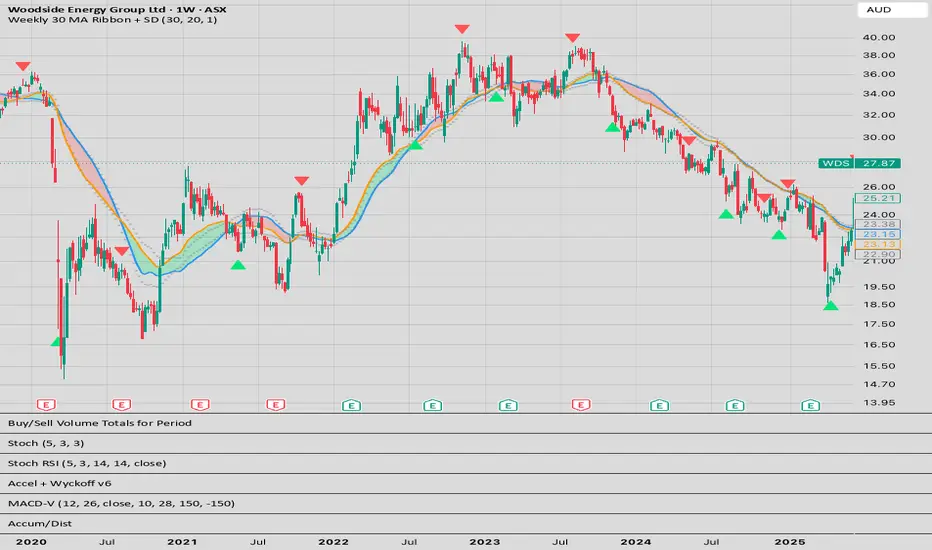
Classic 30-week moving average ribbon (Stan Weinstein / Stage Analysis style) with added Spread + Standard Deviation bands for volatility awareness.
Key Features
True Weekly 30 SMA & 30 EMA (your 30-week MA)
Colored ribbon between the two MAs (Red when SMA > EMA, Green when EMA > SMA)
Spread ± Standard Deviation bands (default 20-period)
Visual cross markers
Works best on Daily or Weekly charts
How to Use
Best viewed on Daily or Weekly charts.
Green ribbon = EMA above SMA (bullish trend support in Stage 2 - RED FLAG indicators crossover).
Red ribbon = SMA above EMA (bearish or distribution - GREEN FLAG indicators crossover) - [I forgot to change the flag colours to match, you can do this adjustment yourself.]
Monitor how far the ribbon stretches relative to the SD bands — wide spreads often precede mean reversion or acceleration.
Adjust SD Length for more/less sensitivity (20 is balanced).
Pros
Directly implements the popular 30-week MA concept
SD bands add objective volatility context to traditional stage analysis
Excellent for identifying accumulation/distribution phases and trend strength
Clean and not over-cluttered
Cons / Limitations
Weekly data updates more slowly (less useful for very short-term trading)
Color scheme is intentionally swapped — users may need a short adjustment period
Like all MA tools, it lags price and works best in trending markets
Classic 30-week moving average ribbon (Stan Weinstein / Stage Analysis style) with added Spread + Standard Deviation bands for volatility awareness.
Key Features
True Weekly 30 SMA & 30 EMA (your 30-week MA)
Colored ribbon between the two MAs (Red when SMA > EMA, Green when EMA > SMA)
Spread ± Standard Deviation bands (default 20-period)
Visual cross markers
Works best on Daily or Weekly charts
How to Use
Best viewed on Daily or Weekly charts.
Green ribbon = EMA above SMA (bullish trend support in Stage 2 - RED FLAG indicators crossover).
Red ribbon = SMA above EMA (bearish or distribution - GREEN FLAG indicators crossover) - [I forgot to change the flag colours to match, you can do this adjustment yourself.]
Monitor how far the ribbon stretches relative to the SD bands — wide spreads often precede mean reversion or acceleration.
Adjust SD Length for more/less sensitivity (20 is balanced).
Pros
Directly implements the popular 30-week MA concept
SD bands add objective volatility context to traditional stage analysis
Excellent for identifying accumulation/distribution phases and trend strength
Clean and not over-cluttered
Cons / Limitations
Weekly data updates more slowly (less useful for very short-term trading)
Color scheme is intentionally swapped — users may need a short adjustment period
Like all MA tools, it lags price and works best in trending markets
오픈 소스 스크립트
트레이딩뷰의 진정한 정신에 따라, 이 스크립트의 작성자는 이를 오픈소스로 공개하여 트레이더들이 기능을 검토하고 검증할 수 있도록 했습니다. 작성자에게 찬사를 보냅니다! 이 코드는 무료로 사용할 수 있지만, 코드를 재게시하는 경우 하우스 룰이 적용된다는 점을 기억하세요.

면책사항
해당 정보와 게시물은 금융, 투자, 트레이딩 또는 기타 유형의 조언이나 권장 사항으로 간주되지 않으며, 트레이딩뷰에서 제공하거나 보증하는 것이 아닙니다. 자세한 내용은 이용 약관을 참조하세요.
오픈 소스 스크립트
트레이딩뷰의 진정한 정신에 따라, 이 스크립트의 작성자는 이를 오픈소스로 공개하여 트레이더들이 기능을 검토하고 검증할 수 있도록 했습니다. 작성자에게 찬사를 보냅니다! 이 코드는 무료로 사용할 수 있지만, 코드를 재게시하는 경우 하우스 룰이 적용된다는 점을 기억하세요.
면책사항
해당 정보와 게시물은 금융, 투자, 트레이딩 또는 기타 유형의 조언이나 권장 사항으로 간주되지 않으며, 트레이딩뷰에서 제공하거나 보증하는 것이 아닙니다. 자세한 내용은 이용 약관을 참조하세요.