CRT Multi-Timeframe Levels v3
How to Read the CRT Multi-Timeframe Levels Indicator (v3)
A field guide to every element on the chart and what it means.
1. What the indicator is looking for
The indicator finds a three-candle CRT pattern on the timeframes you choose (by default 8H, Daily and 4H).
• Candle 1 sets the range, from its high to its low.
• Candle 2 sweeps one side of that range (takes out the high or the low), then closes back inside candle 1's range. If candle 2 sweeps both sides, it is ignored.
• Candle 3 is where the trade happens. The idea is that price moves from the sweep back through the range toward the opposite side.
The indicator marks the setup once candle 2 has closed, then tracks what candle 3 and later candles do with it.
2. The elements on your chart
The label
Each signal has one label, for example CRT ▲ A 8H. Read it left to right:
Part
Meaning
CRT ▲ / CRT ▼
Direction of the setup. ▲ is bullish, ▼ is bearish.
A / B
Grade of candle 2's close (see section 4).
8H
The timeframe the CRT formed on.
✓50% / ✓TP (added later)
Target status (see section 5).
The label sits at the middle of candle 2, on its sweep wick: at the low for bullish setups, at the high for bearish ones.
The three lines
All three lines start at candle 1 and extend to the right.
• Solid line at candle 1's high.
• Solid line at candle 1's low.
• Dashed line at candle 1's midpoint (50%). This can be turned off in settings.
While a setup is being tracked, the lines keep extending to the current bar, so you can see them on any lower timeframe.
The colors
Color
Meaning
Green
Bullish setup, active.
Red
Bearish setup, active.
Orange (dotted)
The 50% target has been reached.
Gray (dotted)
The full target has been reached.
Both the orange and gray colors are inputs, so you can change them.
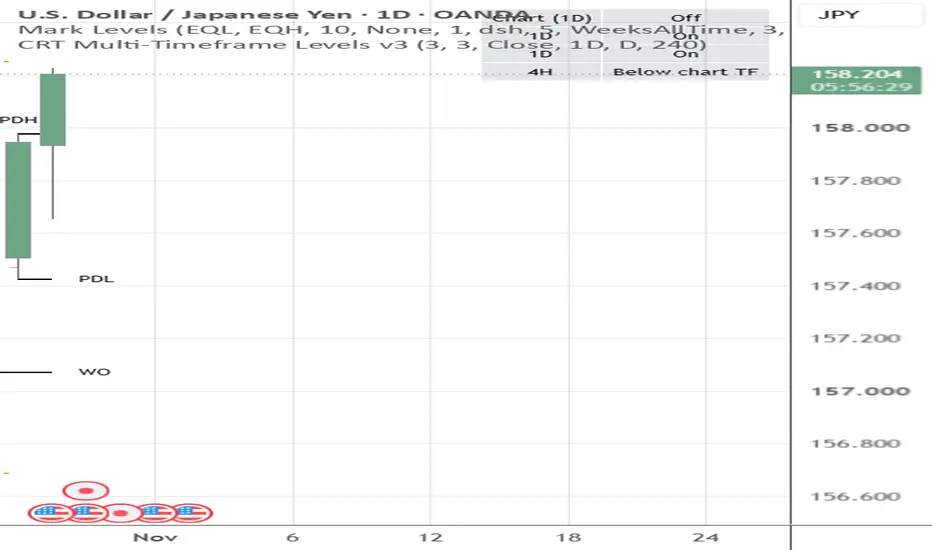
The status table (top right)
This small table lists the chart timeframe and your three timeframe slots, each marked On, Off, or Below chart TF. "Below chart TF" means that slot's timeframe is lower than the chart you're on, so it can't be calculated and is hidden. If you expect to see a signal and don't, check this first.
3. Reading direction and targets
Bullish (CRT ▲, green): candle 2 swept below candle 1's low and closed back inside the range.
• Invalidation level: candle 2's low.
• First target: candle 1's 50% line.
• Full target: candle 1's high.
Bearish (CRT ▼, red): candle 2 swept above candle 1's high and closed back inside the range.
• Invalidation level: candle 2's high.
• First target: candle 1's 50% line.
• Full target: candle 1's low.
4. Reading the grade
The grade describes how candle 2 closed.
• Grade A: candle 2 closed past the 50% line of candle 1 (above it for bullish, below it for bearish). It swept and then closed with conviction.
• Grade B: candle 2 closed back inside the range, but not past the 50% line. It still qualifies as a CRT, but the close was weaker.
The grade is only a description of candle 2's close. It is not a probability, and you should check on your own markets whether A setups actually perform better than B setups.
5. The life of a signal
Every signal moves through the same stages.
1. Appears (green or red). The signal is created on the first confirmed chart bar after candle 2 closes, which is the start of candle 3 on that timeframe. It never appears while candle 2 is still forming, so it will not vanish before the close.
2. 50% hit (orange, "✓50%"). Price has traded to the candle 1 midpoint. The lines turn orange and dotted.
3. Full target hit (gray, "✓TP"). Price has traded to the opposite extreme of candle 1. The lines turn gray and dotted, and tracking stops. The drawings stay on the chart.
4. Invalidated (disappears). Before the 50% target is reached, price goes beyond candle 2's extreme. The label and lines are deleted. A signal vanishing is intended behavior, not a glitch. Once the 50% target has been hit, a signal can no longer be invalidated.
5. Window ends (stays as is). If neither target is hit within the tracking window (default 3 higher-timeframe candles after candle 2), tracking simply stops. The signal stays on the chart in its original green or red.
Note that a green or red signal is therefore either still active or expired without hitting anything. The indicator doesn't visually distinguish between those two cases, so check how far it is from the candle it formed on.
6. Using it across timeframes
The main use is to spot a CRT on a higher timeframe and then drop down to refine entries.
• The levels from the 8H, Daily or 4H CRT stay drawn on the 15m or any lower chart.
• The label tells you which timeframe each set of levels came from, so you can tell them apart when several slots are on.
• If the chart gets cluttered, turn slots off individually or lower "Max Signals Shown Per Timeframe" (default 3), which keeps only the most recent signals for each slot.
• Slots must be at or above the chart's timeframe. On a 4H chart, the 4H slot works, but a 1H slot would show "Below chart TF".
7. Timing details worth knowing
• Signals come from completed higher-timeframe candles only, so they do not repaint.
• Targets and invalidation are checked on confirmed chart bars. On a 15m chart, a target is registered when the 15m bar that touched it closes.
• "Invalidate When Price" has two modes. Close requires a chart-timeframe close beyond candle 2's extreme, so on a 15m chart it's a 15m close, not an 8H close. Touch invalidates on any wick beyond it.
• The Chart Timeframe option (off by default) shows signals one bar later than the earlier versions, because it works the same way as the higher-timeframe slots.
8. What the indicator does not tell you
• It does not give entries or stops. It marks the range and targets; you decide where to enter within it.
• It does not check higher-timeframe bias, so a CRT against the larger trend looks the same as one with it.
• It does not tell you whether a setup is good in context. Where candle 1 sits in the larger range, volatility, and news all matter.
• It does not keep statistics yet. A stats table counting how often A and B setups reach 50% and full targets would be a useful addition.
9. Quick reading checklist
1. Which direction is the label (▲ or ▼)?
2. What timeframe is it from, and is that slot the one you care about?
3. What's the grade, A or B?
4. What color is it: still active (green/red), or already played out (orange/gray)?
5. Where are the 50% line and the opposite extreme of candle 1 relative to current price?
6. Where is candle 2's extreme, which is the level that would invalidate the setup?
A field guide to every element on the chart and what it means.
1. What the indicator is looking for
The indicator finds a three-candle CRT pattern on the timeframes you choose (by default 8H, Daily and 4H).
• Candle 1 sets the range, from its high to its low.
• Candle 2 sweeps one side of that range (takes out the high or the low), then closes back inside candle 1's range. If candle 2 sweeps both sides, it is ignored.
• Candle 3 is where the trade happens. The idea is that price moves from the sweep back through the range toward the opposite side.
The indicator marks the setup once candle 2 has closed, then tracks what candle 3 and later candles do with it.
2. The elements on your chart
The label
Each signal has one label, for example CRT ▲ A 8H. Read it left to right:
Part
Meaning
CRT ▲ / CRT ▼
Direction of the setup. ▲ is bullish, ▼ is bearish.
A / B
Grade of candle 2's close (see section 4).
8H
The timeframe the CRT formed on.
✓50% / ✓TP (added later)
Target status (see section 5).
The label sits at the middle of candle 2, on its sweep wick: at the low for bullish setups, at the high for bearish ones.
The three lines
All three lines start at candle 1 and extend to the right.
• Solid line at candle 1's high.
• Solid line at candle 1's low.
• Dashed line at candle 1's midpoint (50%). This can be turned off in settings.
While a setup is being tracked, the lines keep extending to the current bar, so you can see them on any lower timeframe.
The colors
Color
Meaning
Green
Bullish setup, active.
Red
Bearish setup, active.
Orange (dotted)
The 50% target has been reached.
Gray (dotted)
The full target has been reached.
Both the orange and gray colors are inputs, so you can change them.
The status table (top right)
This small table lists the chart timeframe and your three timeframe slots, each marked On, Off, or Below chart TF. "Below chart TF" means that slot's timeframe is lower than the chart you're on, so it can't be calculated and is hidden. If you expect to see a signal and don't, check this first.
3. Reading direction and targets
Bullish (CRT ▲, green): candle 2 swept below candle 1's low and closed back inside the range.
• Invalidation level: candle 2's low.
• First target: candle 1's 50% line.
• Full target: candle 1's high.
Bearish (CRT ▼, red): candle 2 swept above candle 1's high and closed back inside the range.
• Invalidation level: candle 2's high.
• First target: candle 1's 50% line.
• Full target: candle 1's low.
4. Reading the grade
The grade describes how candle 2 closed.
• Grade A: candle 2 closed past the 50% line of candle 1 (above it for bullish, below it for bearish). It swept and then closed with conviction.
• Grade B: candle 2 closed back inside the range, but not past the 50% line. It still qualifies as a CRT, but the close was weaker.
The grade is only a description of candle 2's close. It is not a probability, and you should check on your own markets whether A setups actually perform better than B setups.
5. The life of a signal
Every signal moves through the same stages.
1. Appears (green or red). The signal is created on the first confirmed chart bar after candle 2 closes, which is the start of candle 3 on that timeframe. It never appears while candle 2 is still forming, so it will not vanish before the close.
2. 50% hit (orange, "✓50%"). Price has traded to the candle 1 midpoint. The lines turn orange and dotted.
3. Full target hit (gray, "✓TP"). Price has traded to the opposite extreme of candle 1. The lines turn gray and dotted, and tracking stops. The drawings stay on the chart.
4. Invalidated (disappears). Before the 50% target is reached, price goes beyond candle 2's extreme. The label and lines are deleted. A signal vanishing is intended behavior, not a glitch. Once the 50% target has been hit, a signal can no longer be invalidated.
5. Window ends (stays as is). If neither target is hit within the tracking window (default 3 higher-timeframe candles after candle 2), tracking simply stops. The signal stays on the chart in its original green or red.
Note that a green or red signal is therefore either still active or expired without hitting anything. The indicator doesn't visually distinguish between those two cases, so check how far it is from the candle it formed on.
6. Using it across timeframes
The main use is to spot a CRT on a higher timeframe and then drop down to refine entries.
• The levels from the 8H, Daily or 4H CRT stay drawn on the 15m or any lower chart.
• The label tells you which timeframe each set of levels came from, so you can tell them apart when several slots are on.
• If the chart gets cluttered, turn slots off individually or lower "Max Signals Shown Per Timeframe" (default 3), which keeps only the most recent signals for each slot.
• Slots must be at or above the chart's timeframe. On a 4H chart, the 4H slot works, but a 1H slot would show "Below chart TF".
7. Timing details worth knowing
• Signals come from completed higher-timeframe candles only, so they do not repaint.
• Targets and invalidation are checked on confirmed chart bars. On a 15m chart, a target is registered when the 15m bar that touched it closes.
• "Invalidate When Price" has two modes. Close requires a chart-timeframe close beyond candle 2's extreme, so on a 15m chart it's a 15m close, not an 8H close. Touch invalidates on any wick beyond it.
• The Chart Timeframe option (off by default) shows signals one bar later than the earlier versions, because it works the same way as the higher-timeframe slots.
8. What the indicator does not tell you
• It does not give entries or stops. It marks the range and targets; you decide where to enter within it.
• It does not check higher-timeframe bias, so a CRT against the larger trend looks the same as one with it.
• It does not tell you whether a setup is good in context. Where candle 1 sits in the larger range, volatility, and news all matter.
• It does not keep statistics yet. A stats table counting how often A and B setups reach 50% and full targets would be a useful addition.
9. Quick reading checklist
1. Which direction is the label (▲ or ▼)?
2. What timeframe is it from, and is that slot the one you care about?
3. What's the grade, A or B?
4. What color is it: still active (green/red), or already played out (orange/gray)?
5. Where are the 50% line and the opposite extreme of candle 1 relative to current price?
6. Where is candle 2's extreme, which is the level that would invalidate the setup?

면책사항
해당 정보와 게시물은 금융, 투자, 트레이딩 또는 기타 유형의 조언이나 권장 사항으로 간주되지 않으며, 트레이딩뷰에서 제공하거나 보증하는 것이 아닙니다. 자세한 내용은 이용 약관을 참조하세요.
면책사항
해당 정보와 게시물은 금융, 투자, 트레이딩 또는 기타 유형의 조언이나 권장 사항으로 간주되지 않으며, 트레이딩뷰에서 제공하거나 보증하는 것이 아닙니다. 자세한 내용은 이용 약관을 참조하세요.