OPEN-SOURCE SCRIPT
Dynamic Pivot Structure [DPS]
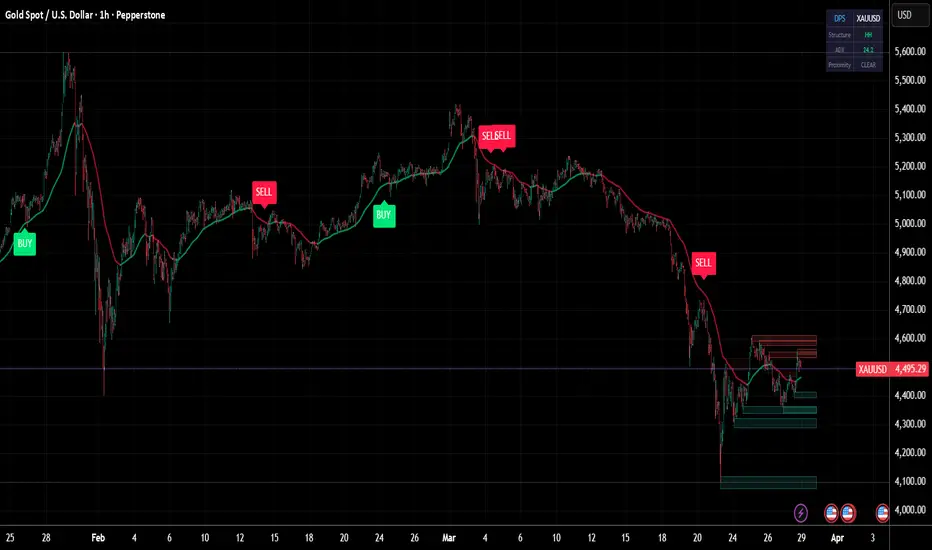
Dynamic Pivot Structure (DPS) is a price structure analysis tool that automatically detects pivot points, classifies market structure (HH, HL, LH, LL), and generates dynamic support/resistance zones with mitigation tracking.

**Mathematical Foundation:**
The indicator uses the standard pivot point detection algorithm with configurable left and right bar confirmations. A pivot high is confirmed when the high of a bar is greater than the highs of all N bars to its left and N bars to its right. Similarly for pivot lows. This provides mathematically validated local extremes rather than arbitrary level selection.
Market structure classification follows the Dow Theory framework: Higher Highs (HH) and Higher Lows (HL) define uptrends; Lower Highs (LH) and Lower Lows (LL) define downtrends. The indicator tracks consecutive pivot sequences and labels each new pivot with its structural classification.

Support and resistance zones are generated around each pivot using the Average True Range (ATR) for zone width. This creates proportional zones that automatically adjust to the instrument's volatility. The indicator tracks zone mitigation — when price penetrates a zone, it is marked as mitigated and visually faded.
**Signal Logic:**
Buy signals fire when price is near an unmitigated support zone, above the trend EMA, with RSI below 40 or bullish structure (HH/HL), and ADX confirming a trending environment. Sell signals fire near resistance with bearish conditions.

**Features:**
- Automatic pivot high/low detection with adjustable sensitivity
- Market structure classification (HH, HL, LH, LL)
- Dynamic ATR-based support and resistance zones
- Zone mitigation tracking with visual feedback
- ADX trend strength filter
- Trend EMA overlay
- Dashboard showing structure type, ADX, and proximity status
**Mathematical Foundation:**
The indicator uses the standard pivot point detection algorithm with configurable left and right bar confirmations. A pivot high is confirmed when the high of a bar is greater than the highs of all N bars to its left and N bars to its right. Similarly for pivot lows. This provides mathematically validated local extremes rather than arbitrary level selection.
Market structure classification follows the Dow Theory framework: Higher Highs (HH) and Higher Lows (HL) define uptrends; Lower Highs (LH) and Lower Lows (LL) define downtrends. The indicator tracks consecutive pivot sequences and labels each new pivot with its structural classification.
Support and resistance zones are generated around each pivot using the Average True Range (ATR) for zone width. This creates proportional zones that automatically adjust to the instrument's volatility. The indicator tracks zone mitigation — when price penetrates a zone, it is marked as mitigated and visually faded.
**Signal Logic:**
Buy signals fire when price is near an unmitigated support zone, above the trend EMA, with RSI below 40 or bullish structure (HH/HL), and ADX confirming a trending environment. Sell signals fire near resistance with bearish conditions.
**Features:**
- Automatic pivot high/low detection with adjustable sensitivity
- Market structure classification (HH, HL, LH, LL)
- Dynamic ATR-based support and resistance zones
- Zone mitigation tracking with visual feedback
- ADX trend strength filter
- Trend EMA overlay
- Dashboard showing structure type, ADX, and proximity status
오픈 소스 스크립트
트레이딩뷰의 진정한 정신에 따라, 이 스크립트의 작성자는 이를 오픈소스로 공개하여 트레이더들이 기능을 검토하고 검증할 수 있도록 했습니다. 작성자에게 찬사를 보냅니다! 이 코드는 무료로 사용할 수 있지만, 코드를 재게시하는 경우 하우스 룰이 적용된다는 점을 기억하세요.

면책사항
해당 정보와 게시물은 금융, 투자, 트레이딩 또는 기타 유형의 조언이나 권장 사항으로 간주되지 않으며, 트레이딩뷰에서 제공하거나 보증하는 것이 아닙니다. 자세한 내용은 이용 약관을 참조하세요.
오픈 소스 스크립트
트레이딩뷰의 진정한 정신에 따라, 이 스크립트의 작성자는 이를 오픈소스로 공개하여 트레이더들이 기능을 검토하고 검증할 수 있도록 했습니다. 작성자에게 찬사를 보냅니다! 이 코드는 무료로 사용할 수 있지만, 코드를 재게시하는 경우 하우스 룰이 적용된다는 점을 기억하세요.
면책사항
해당 정보와 게시물은 금융, 투자, 트레이딩 또는 기타 유형의 조언이나 권장 사항으로 간주되지 않으며, 트레이딩뷰에서 제공하거나 보증하는 것이 아닙니다. 자세한 내용은 이용 약관을 참조하세요.