Intraday Quick Stop Loss ATR distance
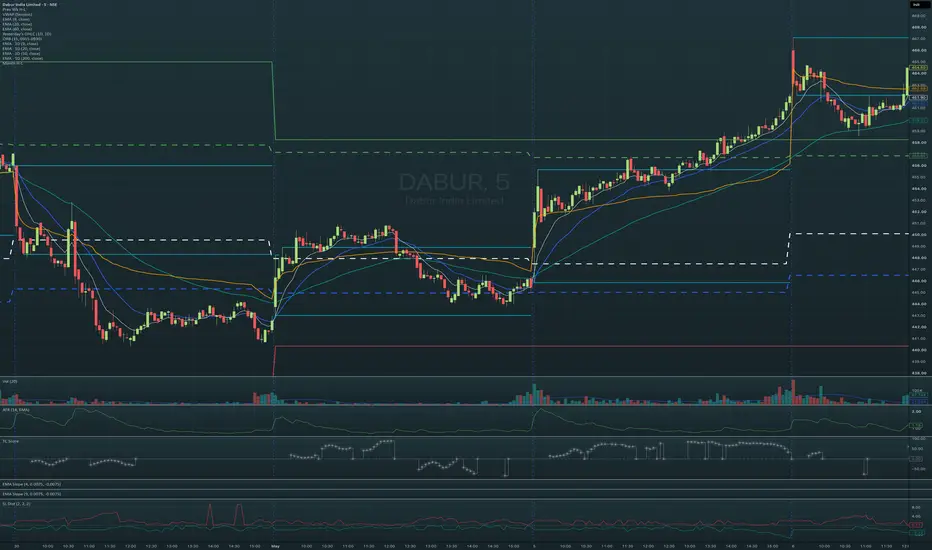
# Intraday Pivot SL Distance
**Intraday Pivot SL Distance** is a technical indicator designed to measure the distance between the current price and the nearest confirmed intraday pivot highs and lows, expressed in ATR (Average True Range) units.
The indicator helps traders identify potential stop-loss levels based on recent price structure while accounting for market volatility.
## How It Works
The indicator identifies pivot highs and pivot lows using configurable lookback lengths.
- **Pivot High:** A candle whose high is greater than or equal to the highs of the specified number of candles on both sides.
- **Pivot Low:** A candle whose low is less than or equal to the lows of the specified number of candles on both sides.
Only confirmed pivots from the current trading day are considered. Pivot levels are reset at the beginning of each new trading day.
For every candle, the indicator calculates:
**Short SL Distance (Red Line)**
Identifies the nearest confirmed pivot high above the current closing price.
`Short SL = (Nearest Pivot High - Close) / ATR`
**Long SL Distance (Green Line)**
Identifies the nearest confirmed pivot low below the current closing price.
`Long SL = (Close - Nearest Pivot Low) / ATR`
The Long SL distance is plotted as a negative value for easier visual distinction.
ATR is calculated using a 14-period Exponential Moving Average (EMA) of True Range.
If no qualifying pivot is available, the indicator uses a configurable ATR-based fallback value.
## Input Parameters
1. **Pivot High Length:** Number of candles on each side required to confirm a pivot high.
2. **Pivot Low Length:** Number of candles on each side required to confirm a pivot low.
3. **ATR Multiplier:** Determines the fallback stop-loss distance when no qualifying pivot exists.
## Interpreting the Indicator
- **Smaller absolute values:** The nearest relevant pivot is relatively close to the current price, indicating a potentially tighter structural stop-loss.
- **Larger absolute values:** The nearest relevant pivot is farther away, implying a wider structural stop-loss.
- **Positive red line:** Potential short-side stop-loss distance.
- **Negative green line:** Potential long-side stop-loss distance.
Since the distances are normalized by ATR when a qualifying pivot exists, traders can compare relative stop-loss distances across instruments with different prices and volatility levels.
## Key Features
- Intraday pivot detection with configurable sensitivity
- Automatic pivot reset at the beginning of each trading day
- ATR-based normalization of pivot distances
- Separate visualization of long and short stop-loss distances
- Configurable fallback when no qualifying pivot exists
- Confirmed pivot detection without using future information in live calculations
## Important Notes
- Pivots require candles on both sides for confirmation, so newly forming pivots are not immediately available.
- Previously confirmed pivots remain eligible throughout the trading day.
- The indicator is intended primarily for intraday timeframes.
- The indicator measures potential structural stop-loss distances; it does not generate entry or exit signals.
- A pivot-based stop-loss does not guarantee protection against gaps, slippage, or sudden price movements.
**Disclaimer:** This indicator is intended for technical analysis and informational purposes only. It should be used alongside appropriate risk management and other trading analysis tools.
**Intraday Pivot SL Distance** is a technical indicator designed to measure the distance between the current price and the nearest confirmed intraday pivot highs and lows, expressed in ATR (Average True Range) units.
The indicator helps traders identify potential stop-loss levels based on recent price structure while accounting for market volatility.
## How It Works
The indicator identifies pivot highs and pivot lows using configurable lookback lengths.
- **Pivot High:** A candle whose high is greater than or equal to the highs of the specified number of candles on both sides.
- **Pivot Low:** A candle whose low is less than or equal to the lows of the specified number of candles on both sides.
Only confirmed pivots from the current trading day are considered. Pivot levels are reset at the beginning of each new trading day.
For every candle, the indicator calculates:
**Short SL Distance (Red Line)**
Identifies the nearest confirmed pivot high above the current closing price.
`Short SL = (Nearest Pivot High - Close) / ATR`
**Long SL Distance (Green Line)**
Identifies the nearest confirmed pivot low below the current closing price.
`Long SL = (Close - Nearest Pivot Low) / ATR`
The Long SL distance is plotted as a negative value for easier visual distinction.
ATR is calculated using a 14-period Exponential Moving Average (EMA) of True Range.
If no qualifying pivot is available, the indicator uses a configurable ATR-based fallback value.
## Input Parameters
1. **Pivot High Length:** Number of candles on each side required to confirm a pivot high.
2. **Pivot Low Length:** Number of candles on each side required to confirm a pivot low.
3. **ATR Multiplier:** Determines the fallback stop-loss distance when no qualifying pivot exists.
## Interpreting the Indicator
- **Smaller absolute values:** The nearest relevant pivot is relatively close to the current price, indicating a potentially tighter structural stop-loss.
- **Larger absolute values:** The nearest relevant pivot is farther away, implying a wider structural stop-loss.
- **Positive red line:** Potential short-side stop-loss distance.
- **Negative green line:** Potential long-side stop-loss distance.
Since the distances are normalized by ATR when a qualifying pivot exists, traders can compare relative stop-loss distances across instruments with different prices and volatility levels.
## Key Features
- Intraday pivot detection with configurable sensitivity
- Automatic pivot reset at the beginning of each trading day
- ATR-based normalization of pivot distances
- Separate visualization of long and short stop-loss distances
- Configurable fallback when no qualifying pivot exists
- Confirmed pivot detection without using future information in live calculations
## Important Notes
- Pivots require candles on both sides for confirmation, so newly forming pivots are not immediately available.
- Previously confirmed pivots remain eligible throughout the trading day.
- The indicator is intended primarily for intraday timeframes.
- The indicator measures potential structural stop-loss distances; it does not generate entry or exit signals.
- A pivot-based stop-loss does not guarantee protection against gaps, slippage, or sudden price movements.
**Disclaimer:** This indicator is intended for technical analysis and informational purposes only. It should be used alongside appropriate risk management and other trading analysis tools.

면책사항
해당 정보와 게시물은 금융, 투자, 트레이딩 또는 기타 유형의 조언이나 권장 사항으로 간주되지 않으며, 트레이딩뷰에서 제공하거나 보증하는 것이 아닙니다. 자세한 내용은 이용 약관을 참조하세요.
면책사항
해당 정보와 게시물은 금융, 투자, 트레이딩 또는 기타 유형의 조언이나 권장 사항으로 간주되지 않으며, 트레이딩뷰에서 제공하거나 보증하는 것이 아닙니다. 자세한 내용은 이용 약관을 참조하세요.