업데이트됨
SectorFlow Clean - Leaders Laggards + Heatmap
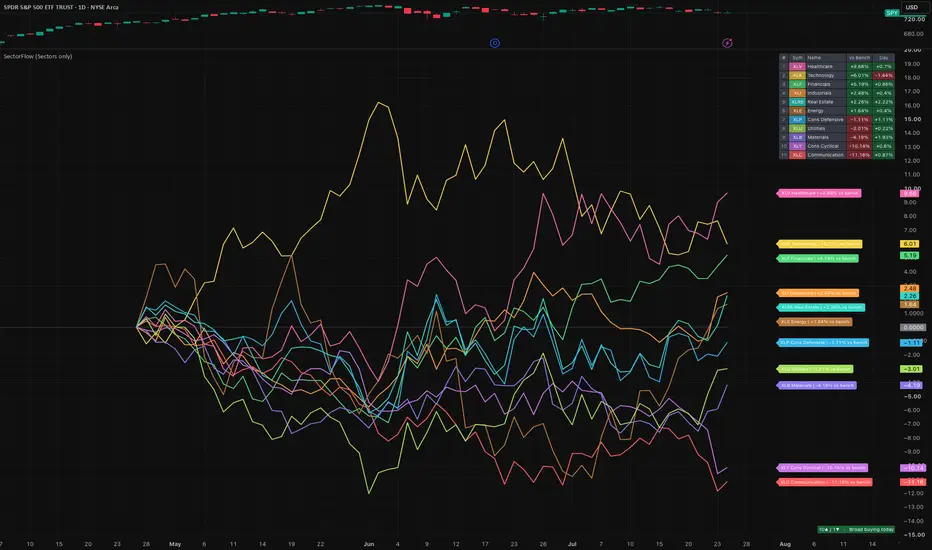
Default setting:
Line metric: Relative to SPY
Line display mode: Leaders + laggards only
Show top N leaders: 3
Show bottom N laggards: 3
Show compact heatmap table: On
Line metric: Relative to SPY
Line display mode: Leaders + laggards only
Show top N leaders: 3
Show bottom N laggards: 3
Show compact heatmap table: On
릴리즈 노트
v3 — Multi-universe rebuild, corrected relative-return maths, sorted heatmap, alerts■ New — 38 symbols in 4 switchable groups
Every slot has a checkbox and an editable ticker. Use Focus → Show group to switch universe; ranking, lines, labels, breadth and the table all follow the active group automatically.
Sectors (11, on by default) —
 XLK XLF XLI XLY XLC XLB XLE XLRE XLV XLU XLP
Themes (15) —
 SMH
 IGV
 AIQ
 QTUM
 CIBR BOTZ
 ARKX ITA URA NLR GRID ICLN XBI IBIT PAVE
Factor & Style (6) —
 RSP IWM MTUM QUAL VLUE USMV
Custom (6) — any ticker you like, each with its own label field
Tip: view one group at a time.
RSP against SPY is the cleanest breadth read available here — if RSP leads, the average stock is beating the mega-caps.■ New — sorted vertical heatmap
The old horizontal layout could not survive 38 columns, so the table is now one row per symbol, ranked strongest to weakest:
# Sym Name vs Bench Day
1 XLK Technology +8.69% +2.89%
2 XLV Healthcare +4.05% +0.63%
3 XLF Financials +2.15% +0.12%
…
11 XLC Communication -11.28% -0.69%
Row 1 is always today’s leader — no hunting for it
★ marks a symbol that crossed the benchmark line this bar (just flipped from lagging to beating, or vice-versa). This is the rotation signal v1 had the data for but never surfaced
Position (left / right) and text size are configurable
■ New — other additions
Alerts. Two of them: new leading symbol, and breadth flip (broad buying / broad selling). Both fire once per bar close. v1 had no alerts at all.
Rolling rebase window. New default: a moving 3-month window that always ends today, so it never goes stale. Year-to-date and manual date are still available under Rebase from.
Selectable benchmark. The 0 line is no longer tied to
SPY — try RSP to strip out mega-cap distortion, or QQQ for a growth-relative view.Label declutter. Right-side labels used to stack and overlap when values were close. They now spread apart automatically — the number shown is still the exact value, only the vertical position is nudged. Adjustable via Label spacing % (set to 0 to disable).
Regime banner. Full-width, colour-coded: green for broad buying, red for broad selling, grey for mixed / rotation.
■ Changed & removed
Palette reworked. v1 had three reddish tones (
XLK red, XLY pink, XLRE magenta) sitting close together, plus duplicate greens and blues. Hues are now spaced around the wheel so no two neighbouring lines are confusable. Red no longer reads as “down”.Default line mode is now All (in group) rather than leaders + laggards only.
Observation event lines, labels and background zones — removed. They were date-specific and did not generalise. If you relied on them, TradingView’s own vertical-line drawing tool covers the same need.
Status line cleaned up. All input values are hidden, so the chart header now shows just SectorFlow instead of a long wall of tickers and numbers.
■ Under the hood
v1 repeated each sector through roughly eight separate stages of copy-pasted code, and ranking was a hand-written function taking ten arguments. Everything now flows through a single loop over arrays. Practical effect: adding or removing a symbol is a one-line change, ranking is a real sort rather than pairwise comparisons, and the whole thing handles 38 symbols in less code than v1 used for 11.
Heads-up on your saved settings. The inputs changed structurally in this version, so settings on existing charts may reset to defaults. Nothing breaks — just re-check your benchmark, rebase window and group selection after updating.
Open source. Feedback and bug reports welcome in the comments.

면책사항
해당 정보와 게시물은 금융, 투자, 트레이딩 또는 기타 유형의 조언이나 권장 사항으로 간주되지 않으며, 트레이딩뷰에서 제공하거나 보증하는 것이 아닙니다. 자세한 내용은 이용 약관을 참조하세요.
면책사항
해당 정보와 게시물은 금융, 투자, 트레이딩 또는 기타 유형의 조언이나 권장 사항으로 간주되지 않으며, 트레이딩뷰에서 제공하거나 보증하는 것이 아닙니다. 자세한 내용은 이용 약관을 참조하세요.