OPEN-SOURCE SCRIPT
업데이트됨 EOB Area - Enhanced Order Block Theory
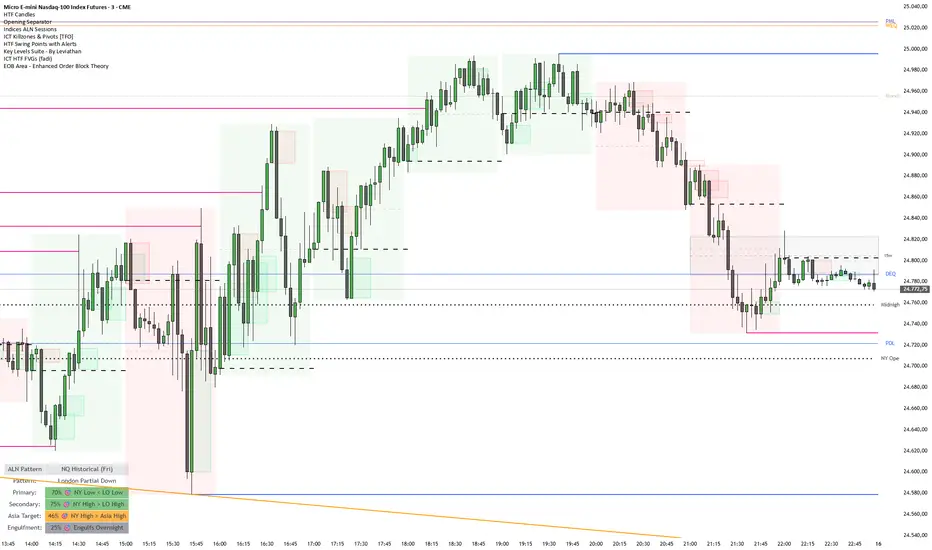
What is this tool?
The EOB Area indicator identifies "Extreme Body Break" (EOB) setups—a particularly strong variation of the classic Engulfing pattern that signals an immediate shift in momentum. Unlike a standard engulfing pattern, an EOB requires the body of the current candle to close beyond the wick (extreme high/low) of the previous candle.
In addition to the signal, the tool automatically draws Support & Resistance Zones based on the broken candle structure. These zones are now fully dynamic and adjustable to fit your trading style (e.g., focusing only on the wick or the entire body).
How does the strategy work?
An EOB (Extreme Body Break) occurs when the market reverses with high volume and conviction:
📈 Bullish EOB: A green candle closes with its Body above the High of the previous red candle.
📉 Bearish EOB: A red candle closes with its Body below the Low of the previous green candle.
This behavior signals that buyers (or sellers) have taken full control, overcoming even the most extreme price levels of the previous period.
Key Features & Settings
1. Zone Display Mode (New!)
You can now control exactly how the Order Block / Zone is drawn based on your strategy:
Entire Candle: Marks the full range (High to Low) of the previous candle. Best for conservative stop placements.
Body + Wick (Default): Marks the area from the Wick to the Body.
Bullish: Previous High to Close.
Bearish: Previous Close to Low.
Wick Only: Marks only the wick area. Ideal for precise "sniper" entries on re-tests.
2. Violation Filter (Auto-Cleanup)
To keep your chart clean, the indicator features a "Violation" logic (Hide Violated EOB Zones).
If enabled: Once price breaks through the opposite side of a drawn zone (invalidating it), the box is automatically deleted from the chart. You only see zones that are still fresh and respected.
3. Integrated Alerts
The indicator is fully integrated with TradingView's alert system. When creating an alert, you can specifically choose:
Only Bullish Signals
Only Bearish Signals
All Signals (Bull & Bear)
How to use this in trading
Reversals: Look for EOB signals at key higher-timeframe Support/Resistance levels.
Trend Continuation: An EOB forming in the direction of the trend after a pullback is a high-probability continuation signal.
Re-Tests: The boxes drawn by the indicator often act as magnets. Price frequently returns to "test" these zones before continuing, offering excellent entry opportunities.
Disclaimer:
This tool is for educational purposes and technical analysis only. Past performance does not guarantee future results. Always use proper risk management.
The EOB Area indicator identifies "Extreme Body Break" (EOB) setups—a particularly strong variation of the classic Engulfing pattern that signals an immediate shift in momentum. Unlike a standard engulfing pattern, an EOB requires the body of the current candle to close beyond the wick (extreme high/low) of the previous candle.
In addition to the signal, the tool automatically draws Support & Resistance Zones based on the broken candle structure. These zones are now fully dynamic and adjustable to fit your trading style (e.g., focusing only on the wick or the entire body).
How does the strategy work?
An EOB (Extreme Body Break) occurs when the market reverses with high volume and conviction:
📈 Bullish EOB: A green candle closes with its Body above the High of the previous red candle.
📉 Bearish EOB: A red candle closes with its Body below the Low of the previous green candle.
This behavior signals that buyers (or sellers) have taken full control, overcoming even the most extreme price levels of the previous period.
Key Features & Settings
1. Zone Display Mode (New!)
You can now control exactly how the Order Block / Zone is drawn based on your strategy:
Entire Candle: Marks the full range (High to Low) of the previous candle. Best for conservative stop placements.
Body + Wick (Default): Marks the area from the Wick to the Body.
Bullish: Previous High to Close.
Bearish: Previous Close to Low.
Wick Only: Marks only the wick area. Ideal for precise "sniper" entries on re-tests.
2. Violation Filter (Auto-Cleanup)
To keep your chart clean, the indicator features a "Violation" logic (Hide Violated EOB Zones).
If enabled: Once price breaks through the opposite side of a drawn zone (invalidating it), the box is automatically deleted from the chart. You only see zones that are still fresh and respected.
3. Integrated Alerts
The indicator is fully integrated with TradingView's alert system. When creating an alert, you can specifically choose:
Only Bullish Signals
Only Bearish Signals
All Signals (Bull & Bear)
How to use this in trading
Reversals: Look for EOB signals at key higher-timeframe Support/Resistance levels.
Trend Continuation: An EOB forming in the direction of the trend after a pullback is a high-probability continuation signal.
Re-Tests: The boxes drawn by the indicator often act as magnets. Price frequently returns to "test" these zones before continuing, offering excellent entry opportunities.
Disclaimer:
This tool is for educational purposes and technical analysis only. Past performance does not guarantee future results. Always use proper risk management.
릴리즈 노트
Fixed Display Problems오픈 소스 스크립트
트레이딩뷰의 진정한 정신에 따라, 이 스크립트의 작성자는 이를 오픈소스로 공개하여 트레이더들이 기능을 검토하고 검증할 수 있도록 했습니다. 작성자에게 찬사를 보냅니다! 이 코드는 무료로 사용할 수 있지만, 코드를 재게시하는 경우 하우스 룰이 적용된다는 점을 기억하세요.

면책사항
해당 정보와 게시물은 금융, 투자, 트레이딩 또는 기타 유형의 조언이나 권장 사항으로 간주되지 않으며, 트레이딩뷰에서 제공하거나 보증하는 것이 아닙니다. 자세한 내용은 이용 약관을 참조하세요.
오픈 소스 스크립트
트레이딩뷰의 진정한 정신에 따라, 이 스크립트의 작성자는 이를 오픈소스로 공개하여 트레이더들이 기능을 검토하고 검증할 수 있도록 했습니다. 작성자에게 찬사를 보냅니다! 이 코드는 무료로 사용할 수 있지만, 코드를 재게시하는 경우 하우스 룰이 적용된다는 점을 기억하세요.
면책사항
해당 정보와 게시물은 금융, 투자, 트레이딩 또는 기타 유형의 조언이나 권장 사항으로 간주되지 않으며, 트레이딩뷰에서 제공하거나 보증하는 것이 아닙니다. 자세한 내용은 이용 약관을 참조하세요.