OPEN-SOURCE SCRIPT
업데이트됨 Aquila Reale Gold/DXY Correlation v1.4 by giua64
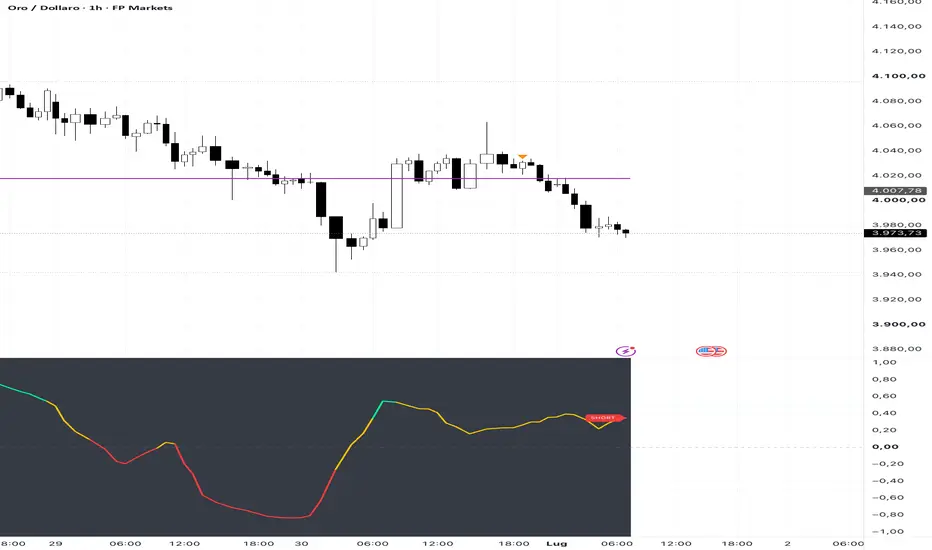
🦅 Aquila Reale Gold/DXY Correlation — by giua64
WHAT IT DOES
This indicator measures the rolling inverse correlation between Gold and the US Dollar in real time. Gold and the Dollar normally move in opposite directions — when that relationship holds, the Dollar is the driver and you can trust it. When the relationship breaks, something else is pushing Gold (real yields, safe-haven flows, fear). Spotting that break is the real edge.
HOW TO READ IT
The correlation is inverted so the chart is intuitive:
Line HIGH and GREEN = strong inverse link (healthy). Gold and Dollar move opposite as they should.
Line YELLOW = the link is weakening.
Line LOW and RED (below zero) = the link is broken. Gold and Dollar are moving the same way — anomaly. Gold is running on its own, not on Dollar weakness.
The midline (zero) is the key reference: above it the inverse relationship is still alive, below it the relationship has flipped.
WHY USDX AND NOT DXY
By default you can use any Dollar symbol in the input. I personally use USDX instead of TVC:DXY because USDX carries volume data, while the TVC Dollar index does not. Correlation is symmetrical (corr A,B = corr B,A), so you only need this indicator on ONE chart — Gold or Dollar, it reads the same link from either side. Using USDX simply lets you keep volume on the Dollar panel.
SETTINGS
Gold symbol and Dollar symbol: fully editable.
Length mode: Auto (preset per timeframe) or Manual. Auto adapts the lookback to the chart TF: 5m=14, 15m=16, 30m=18, 1h=20, 4h=24.
Healthy-link threshold: the level above which the inverse link is considered strong. Suggested sets — Scalping 0.4, Intraday 0.5, Swing 0.6.
ALERTS
Link BROKEN (correlation drops below threshold)
Link RESTORED (correlation back above threshold)
ANOMALY (correlation turns negative — moving together)
DISCLAIMER
This script is for educational and informational purposes only. It is not financial advice. Trading involves risk; always do your own analysis and manage your risk.
🦅 Royal Eagles — born to fly, born to dare!
🦅 Aquile Reali — Be Stable. Be Strong.
WHAT IT DOES
This indicator measures the rolling inverse correlation between Gold and the US Dollar in real time. Gold and the Dollar normally move in opposite directions — when that relationship holds, the Dollar is the driver and you can trust it. When the relationship breaks, something else is pushing Gold (real yields, safe-haven flows, fear). Spotting that break is the real edge.
HOW TO READ IT
The correlation is inverted so the chart is intuitive:
Line HIGH and GREEN = strong inverse link (healthy). Gold and Dollar move opposite as they should.
Line YELLOW = the link is weakening.
Line LOW and RED (below zero) = the link is broken. Gold and Dollar are moving the same way — anomaly. Gold is running on its own, not on Dollar weakness.
The midline (zero) is the key reference: above it the inverse relationship is still alive, below it the relationship has flipped.
WHY USDX AND NOT DXY
By default you can use any Dollar symbol in the input. I personally use USDX instead of TVC:DXY because USDX carries volume data, while the TVC Dollar index does not. Correlation is symmetrical (corr A,B = corr B,A), so you only need this indicator on ONE chart — Gold or Dollar, it reads the same link from either side. Using USDX simply lets you keep volume on the Dollar panel.
SETTINGS
Gold symbol and Dollar symbol: fully editable.
Length mode: Auto (preset per timeframe) or Manual. Auto adapts the lookback to the chart TF: 5m=14, 15m=16, 30m=18, 1h=20, 4h=24.
Healthy-link threshold: the level above which the inverse link is considered strong. Suggested sets — Scalping 0.4, Intraday 0.5, Swing 0.6.
ALERTS
Link BROKEN (correlation drops below threshold)
Link RESTORED (correlation back above threshold)
ANOMALY (correlation turns negative — moving together)
DISCLAIMER
This script is for educational and informational purposes only. It is not financial advice. Trading involves risk; always do your own analysis and manage your risk.
🦅 Royal Eagles — born to fly, born to dare!
🦅 Aquile Reali — Be Stable. Be Strong.
릴리즈 노트
AQUILA REALE GOLD/DXY CORRELATION v1.5🎯 WHAT THIS DOES
Monitors the inverse correlation between Gold (XAUUSD) and the US Dollar Index (DXY) in real-time.
📊 TWO COMPONENTS
1️⃣ CORRELATION LINE (Primary)
Shows strength of the inverse Gold/DXY relationship
Green (0.5+): Healthy inverse correlation
Yellow (0 to 0.5): Weak inverse correlation
Red (below 0): Correlation broken
2️⃣ DOLLAR STRENGTH SIGNAL (Optional Secondary)
Shows if the Dollar is above or below its moving average
LONG GOLD = Dollar below MA (weakening)
SHORT GOLD = Dollar above MA (strengthening)
➜ This signal is optional. Toggle it off if you trade correlation alone.
⚙️ KEY SETTINGS
Auto Window: M1-M5 (14), M15 (16), M30 (18), H1 (20), H4 (24)
Healthy Threshold: 0.5
NY Session Filter: ON (14:00-21:00 UTC)
Dollar SMA: 20 candles
💡 HOW TO USE
Add to XAUUSD chart
Watch the GREEN correlation line
When corr ≥ 0.5, relationship is healthy
Use as CONFLUENCE with your VSA/PA setup
🚨 ALERTS
Dollar crosses above MA → SHORT Gold
Dollar crosses below MA → LONG Gold
🦅 Royal Eagles, born to fly, born to dare
오픈 소스 스크립트
트레이딩뷰의 진정한 정신에 따라, 이 스크립트의 작성자는 이를 오픈소스로 공개하여 트레이더들이 기능을 검토하고 검증할 수 있도록 했습니다. 작성자에게 찬사를 보냅니다! 이 코드는 무료로 사용할 수 있지만, 코드를 재게시하는 경우 하우스 룰이 적용된다는 점을 기억하세요.

AQUILE REALI – Educational tools by giua64
면책사항
해당 정보와 게시물은 금융, 투자, 트레이딩 또는 기타 유형의 조언이나 권장 사항으로 간주되지 않으며, 트레이딩뷰에서 제공하거나 보증하는 것이 아닙니다. 자세한 내용은 이용 약관을 참조하세요.
오픈 소스 스크립트
트레이딩뷰의 진정한 정신에 따라, 이 스크립트의 작성자는 이를 오픈소스로 공개하여 트레이더들이 기능을 검토하고 검증할 수 있도록 했습니다. 작성자에게 찬사를 보냅니다! 이 코드는 무료로 사용할 수 있지만, 코드를 재게시하는 경우 하우스 룰이 적용된다는 점을 기억하세요.
AQUILE REALI – Educational tools by giua64
면책사항
해당 정보와 게시물은 금융, 투자, 트레이딩 또는 기타 유형의 조언이나 권장 사항으로 간주되지 않으며, 트레이딩뷰에서 제공하거나 보증하는 것이 아닙니다. 자세한 내용은 이용 약관을 참조하세요.