OPEN-SOURCE SCRIPT
RSI Swing Structure Indicator (HH, LH, HL, LL + Alerts)
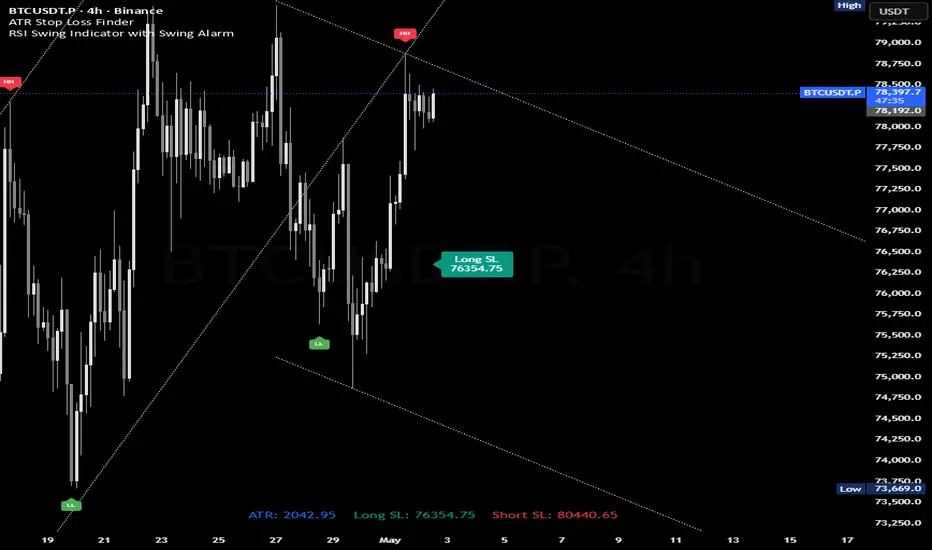
This indicator visualizes market structure using RSI-based swing detection.
It automatically identifies swing highs and lows based on overbought and oversold conditions and classifies them into:
HH (Higher High)
LH (Lower High)
HL (Higher Low)
LL (Lower Low)
How it works
The script uses the RSI to detect momentum extremes:
When RSI reaches the overbought zone, a swing high is formed
When RSI reaches the oversold zone, a swing low is formed
As long as RSI remains in these zones, the swing continues to update dynamically with price.
Once the opposite zone is reached, a new swing is confirmed and the structure is evaluated.
Key Features
Automatic detection of market structure (HH, LH, HL, LL)
Dynamic swing tracking while RSI remains in extreme zones
Optional swing lines connecting highs and lows
Clean chart visualization with minimal noise
Fully configurable RSI settings
Alerts
Built-in alert conditions for:
HH (Higher High)
LH (Lower High)
HL (Higher Low)
LL (Lower Low)
Any new swing event
This allows you to react instantly to structure changes in the market.
Best Use Cases
Trend confirmation and structure analysis
Identifying continuation vs. reversal setups
Combining with EMA, volume, or orderflow strategies
Intraday and swing trading
Tips
Use higher timeframes (e.g. 1H, 4H) for more reliable structure
Combine with trend filters (like EMA 50/100/200) for higher probability setups
Avoid using in low volatility or ranging markets without confirmation
It automatically identifies swing highs and lows based on overbought and oversold conditions and classifies them into:
HH (Higher High)
LH (Lower High)
HL (Higher Low)
LL (Lower Low)
How it works
The script uses the RSI to detect momentum extremes:
When RSI reaches the overbought zone, a swing high is formed
When RSI reaches the oversold zone, a swing low is formed
As long as RSI remains in these zones, the swing continues to update dynamically with price.
Once the opposite zone is reached, a new swing is confirmed and the structure is evaluated.
Key Features
Automatic detection of market structure (HH, LH, HL, LL)
Dynamic swing tracking while RSI remains in extreme zones
Optional swing lines connecting highs and lows
Clean chart visualization with minimal noise
Fully configurable RSI settings
Alerts
Built-in alert conditions for:
HH (Higher High)
LH (Lower High)
HL (Higher Low)
LL (Lower Low)
Any new swing event
This allows you to react instantly to structure changes in the market.
Best Use Cases
Trend confirmation and structure analysis
Identifying continuation vs. reversal setups
Combining with EMA, volume, or orderflow strategies
Intraday and swing trading
Tips
Use higher timeframes (e.g. 1H, 4H) for more reliable structure
Combine with trend filters (like EMA 50/100/200) for higher probability setups
Avoid using in low volatility or ranging markets without confirmation
오픈 소스 스크립트
트레이딩뷰의 진정한 정신에 따라, 이 스크립트의 작성자는 이를 오픈소스로 공개하여 트레이더들이 기능을 검토하고 검증할 수 있도록 했습니다. 작성자에게 찬사를 보냅니다! 이 코드는 무료로 사용할 수 있지만, 코드를 재게시하는 경우 하우스 룰이 적용된다는 점을 기억하세요.

면책사항
해당 정보와 게시물은 금융, 투자, 트레이딩 또는 기타 유형의 조언이나 권장 사항으로 간주되지 않으며, 트레이딩뷰에서 제공하거나 보증하는 것이 아닙니다. 자세한 내용은 이용 약관을 참조하세요.
오픈 소스 스크립트
트레이딩뷰의 진정한 정신에 따라, 이 스크립트의 작성자는 이를 오픈소스로 공개하여 트레이더들이 기능을 검토하고 검증할 수 있도록 했습니다. 작성자에게 찬사를 보냅니다! 이 코드는 무료로 사용할 수 있지만, 코드를 재게시하는 경우 하우스 룰이 적용된다는 점을 기억하세요.
면책사항
해당 정보와 게시물은 금융, 투자, 트레이딩 또는 기타 유형의 조언이나 권장 사항으로 간주되지 않으며, 트레이딩뷰에서 제공하거나 보증하는 것이 아닙니다. 자세한 내용은 이용 약관을 참조하세요.