업데이트됨
Confirmation Table (MTF) - [EGK]
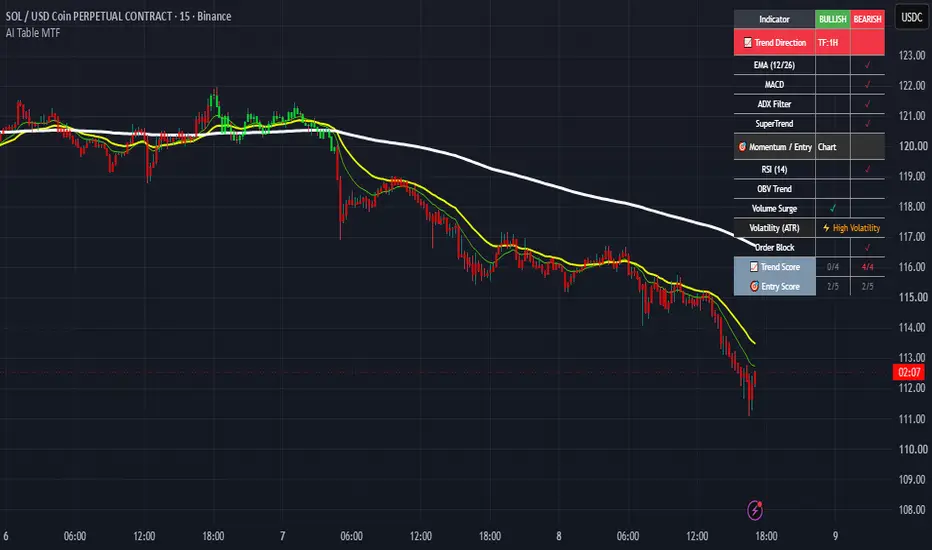
# Confirmation Table (MTF)
The **AI Confirmation Table (MTF)** is an all-in-one multi-timeframe dashboard designed to evaluate market conditions using a quantitative scoring matrix. It aggregates underlying trend direction, volume validation, structural breakouts, and momentum triggers across customizable timeframes into a real-time HUD (Heads-Up Display) overlay.
---
## 🔑 Key Features
- **Multi-Timeframe Engine (MTF):** Track higher timeframe trend dynamics while confirming lower timeframe execution entries simultaneously.
- **Dual-Layer Scoring System:** Separates macro direction (**Trend Score**) from precise execution signals (**Entry Score**).
- **Structure & Volatility Integration:** Built-in Order Block tracking and ATR volatility filters prevent false breakouts during low-liquidity phases.
- **Customizable Interface:** Choose between a fully detailed diagnostic table or a streamlined compact summary view.
- **Dynamic Chart Bar Coloring:** Optional overlay coloring matching the net bias of the mathematical score.
---
## 📊 How It Works & Calculation Logic
The script partitions indicators into two distinct modules to minimize market noise:
### 1. Trend Direction Module
Determines the macroeconomic structural bias:
- **EMA (12/26):** Bullish if Exponential Moving Average 12 is above 26; Bearish if below.
- **MACD (12/26/9):** Bullish if the MACD line is above the Signal Line and greater than 0; Bearish if below signal and below 0.
- **ADX (14):** Confirms trend strength. Active only if ADX > 20 and directional DI (+DI vs -DI) aligns.
- **SuperTrend (3, 10):** Evaluates overall directional bias and trajectory.
### 2. Momentum & Entry Module
Evaluates execution probability and localized market flow:
- **RSI (14):** Bullish above 50 level; Bearish below 50.
- **OBV (On-Balance Volume):** Bullish when OBV is above its 20-period SMA and rising; Bearish when below and falling.
- **Volume Oscillator:** Validates volume expansion when short-term volume exceeds its 20-period moving average.
- **Order Block (Structure):** Tracks pivot highs/lows (3,3) to identify dynamic support/resistance breaks.
- **ATR Volatility Filter:** Flags active volatility phases ( ATR > SMA(ATR, 50)$) to ensure trade viability.
---
## ⚙️ Settings Guide
### 📊 Table Display Settings
- **Display Confirmation Table:** Toggle dashboard visibility on/off.
- **Compact Mode (Summary Only):** Hides individual module rows and displays only the aggregated numeric scores for a clean chart view.
- **Table Position & Size:** Customize table alignment and scale on your screen.
### ⏱️ Timeframe Settings (MTF)
- **Trend Timeframe:** Define the higher timeframe for structural trend evaluation (e.g., 4H, Daily). Leave blank to match current chart timeframe.
- **Entry Timeframe:** Define the timeframe for entry execution triggers (e.g., 5m, 15m). Leave blank to match current chart timeframe.
### 📊 Active Confirmation Modules
- Toggle individual modules on/off. Disabled indicators are automatically excluded from total score recalculations.
### 🎨 Dynamic Bar Coloring
- Paints chart candles dynamically based on dominant score bias (Green for Net Bullish, Red for Net Bearish, Gray for Neutral).
---
## 💡 How to Trade with This Tool
1. **Establish Trend Alignment:** Ensure **Trend Score** exhibits maximum confluence (e.g., 4/4 or 3/4 Bullish).
2. **Wait for Entry Confluence:** Look for **Entry Score** to align with the higher timeframe trend direction.
3. **Volatility Confirmation:** Verify that the **Volatility (ATR)** indicator displays **⚡ High Volatility**, confirming sufficient liquidity for price expansion.
---
*Disclaimer: This script is intended purely for informational and educational purposes. It does not constitute financial or investment advice.*
The **AI Confirmation Table (MTF)** is an all-in-one multi-timeframe dashboard designed to evaluate market conditions using a quantitative scoring matrix. It aggregates underlying trend direction, volume validation, structural breakouts, and momentum triggers across customizable timeframes into a real-time HUD (Heads-Up Display) overlay.
---
## 🔑 Key Features
- **Multi-Timeframe Engine (MTF):** Track higher timeframe trend dynamics while confirming lower timeframe execution entries simultaneously.
- **Dual-Layer Scoring System:** Separates macro direction (**Trend Score**) from precise execution signals (**Entry Score**).
- **Structure & Volatility Integration:** Built-in Order Block tracking and ATR volatility filters prevent false breakouts during low-liquidity phases.
- **Customizable Interface:** Choose between a fully detailed diagnostic table or a streamlined compact summary view.
- **Dynamic Chart Bar Coloring:** Optional overlay coloring matching the net bias of the mathematical score.
---
## 📊 How It Works & Calculation Logic
The script partitions indicators into two distinct modules to minimize market noise:
### 1. Trend Direction Module
Determines the macroeconomic structural bias:
- **EMA (12/26):** Bullish if Exponential Moving Average 12 is above 26; Bearish if below.
- **MACD (12/26/9):** Bullish if the MACD line is above the Signal Line and greater than 0; Bearish if below signal and below 0.
- **ADX (14):** Confirms trend strength. Active only if ADX > 20 and directional DI (+DI vs -DI) aligns.
- **SuperTrend (3, 10):** Evaluates overall directional bias and trajectory.
### 2. Momentum & Entry Module
Evaluates execution probability and localized market flow:
- **RSI (14):** Bullish above 50 level; Bearish below 50.
- **OBV (On-Balance Volume):** Bullish when OBV is above its 20-period SMA and rising; Bearish when below and falling.
- **Volume Oscillator:** Validates volume expansion when short-term volume exceeds its 20-period moving average.
- **Order Block (Structure):** Tracks pivot highs/lows (3,3) to identify dynamic support/resistance breaks.
- **ATR Volatility Filter:** Flags active volatility phases (
ATR > SMA(ATR, 50)$) to ensure trade viability.---
## ⚙️ Settings Guide
### 📊 Table Display Settings
- **Display Confirmation Table:** Toggle dashboard visibility on/off.
- **Compact Mode (Summary Only):** Hides individual module rows and displays only the aggregated numeric scores for a clean chart view.
- **Table Position & Size:** Customize table alignment and scale on your screen.
### ⏱️ Timeframe Settings (MTF)
- **Trend Timeframe:** Define the higher timeframe for structural trend evaluation (e.g., 4H, Daily). Leave blank to match current chart timeframe.
- **Entry Timeframe:** Define the timeframe for entry execution triggers (e.g., 5m, 15m). Leave blank to match current chart timeframe.
### 📊 Active Confirmation Modules
- Toggle individual modules on/off. Disabled indicators are automatically excluded from total score recalculations.
### 🎨 Dynamic Bar Coloring
- Paints chart candles dynamically based on dominant score bias (Green for Net Bullish, Red for Net Bearish, Gray for Neutral).
---
## 💡 How to Trade with This Tool
1. **Establish Trend Alignment:** Ensure **Trend Score** exhibits maximum confluence (e.g., 4/4 or 3/4 Bullish).
2. **Wait for Entry Confluence:** Look for **Entry Score** to align with the higher timeframe trend direction.
3. **Volatility Confirmation:** Verify that the **Volatility (ATR)** indicator displays **⚡ High Volatility**, confirming sufficient liquidity for price expansion.
---
*Disclaimer: This script is intended purely for informational and educational purposes. It does not constitute financial or investment advice.*
릴리즈 노트
Updated chart snapshot릴리즈 노트
Dynamic Timeframe Labels (TF:): Added smart timeframe formatting to table headers. If the MTF timeframe matches the chart, it displays Chart; otherwise, it formats the active period with a TF: prefix (e.g., TF:15m, TF:4H).EMA Engine Integration: Added fully customizable Fast, Slow, and 200 EMA plotting modules with adjustable widths, colors, and Line/Stepline styles.

면책사항
해당 정보와 게시물은 금융, 투자, 트레이딩 또는 기타 유형의 조언이나 권장 사항으로 간주되지 않으며, 트레이딩뷰에서 제공하거나 보증하는 것이 아닙니다. 자세한 내용은 이용 약관을 참조하세요.
면책사항
해당 정보와 게시물은 금융, 투자, 트레이딩 또는 기타 유형의 조언이나 권장 사항으로 간주되지 않으며, 트레이딩뷰에서 제공하거나 보증하는 것이 아닙니다. 자세한 내용은 이용 약관을 참조하세요.