OPEN-SOURCE SCRIPT
9:30 previous day high/low olivierlaporte
🔥 Description (copy this)
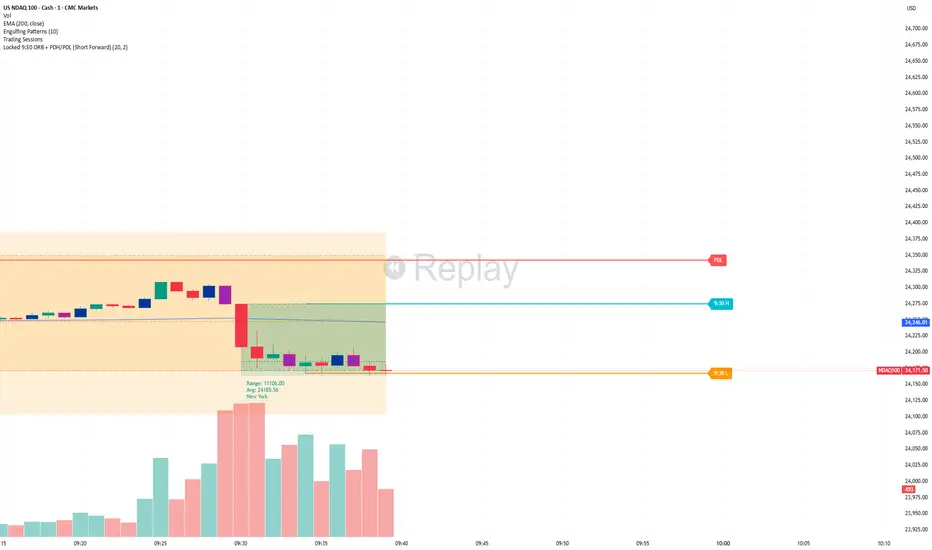
This indicator automatically plots key intraday levels used for high-probability trading setups.
It captures the true 9:30 AM New York 5-minute opening candle (ORB) and extends its high and low forward, allowing traders to clearly identify breakout, retest, and liquidity zones.
In addition, it displays the Previous Day High (PDH) and Previous Day Low (PDL), giving a full view of important higher-timeframe liquidity levels directly on the chart.
All levels are dynamically updated each session and projected forward for clean, uncluttered structure analysis.
⚡ Features:
Automatic detection of the 9:30 AM NY 5-minute range
Plots and extends ORB High & Low
Displays Previous Day High & Low
Clean forward projection for better visibility
Fully automated — no manual drawing needed
🎯 Best Used For:
Breakout and retest strategies
Liquidity sweeps at key levels
Intraday structure trading
Precision entries around NY open
🧠 Notes:
Designed for traders focusing on New York session volatility and liquidity-based setups, combining both intraday and higher-timeframe levels in one tool.
If you want, I can also:
🔥 Add your name branding (Slade / Oliver style)
🔥 Make it sound more “pro trader / hedge fund style”
🔥 Or tailor it specifically to your AI Entry system
This indicator automatically plots key intraday levels used for high-probability trading setups.
It captures the true 9:30 AM New York 5-minute opening candle (ORB) and extends its high and low forward, allowing traders to clearly identify breakout, retest, and liquidity zones.
In addition, it displays the Previous Day High (PDH) and Previous Day Low (PDL), giving a full view of important higher-timeframe liquidity levels directly on the chart.
All levels are dynamically updated each session and projected forward for clean, uncluttered structure analysis.
⚡ Features:
Automatic detection of the 9:30 AM NY 5-minute range
Plots and extends ORB High & Low
Displays Previous Day High & Low
Clean forward projection for better visibility
Fully automated — no manual drawing needed
🎯 Best Used For:
Breakout and retest strategies
Liquidity sweeps at key levels
Intraday structure trading
Precision entries around NY open
🧠 Notes:
Designed for traders focusing on New York session volatility and liquidity-based setups, combining both intraday and higher-timeframe levels in one tool.
If you want, I can also:
🔥 Add your name branding (Slade / Oliver style)
🔥 Make it sound more “pro trader / hedge fund style”
🔥 Or tailor it specifically to your AI Entry system
오픈 소스 스크립트
트레이딩뷰의 진정한 정신에 따라, 이 스크립트의 작성자는 이를 오픈소스로 공개하여 트레이더들이 기능을 검토하고 검증할 수 있도록 했습니다. 작성자에게 찬사를 보냅니다! 이 코드는 무료로 사용할 수 있지만, 코드를 재게시하는 경우 하우스 룰이 적용된다는 점을 기억하세요.

면책사항
해당 정보와 게시물은 금융, 투자, 트레이딩 또는 기타 유형의 조언이나 권장 사항으로 간주되지 않으며, 트레이딩뷰에서 제공하거나 보증하는 것이 아닙니다. 자세한 내용은 이용 약관을 참조하세요.
오픈 소스 스크립트
트레이딩뷰의 진정한 정신에 따라, 이 스크립트의 작성자는 이를 오픈소스로 공개하여 트레이더들이 기능을 검토하고 검증할 수 있도록 했습니다. 작성자에게 찬사를 보냅니다! 이 코드는 무료로 사용할 수 있지만, 코드를 재게시하는 경우 하우스 룰이 적용된다는 점을 기억하세요.
면책사항
해당 정보와 게시물은 금융, 투자, 트레이딩 또는 기타 유형의 조언이나 권장 사항으로 간주되지 않으며, 트레이딩뷰에서 제공하거나 보증하는 것이 아닙니다. 자세한 내용은 이용 약관을 참조하세요.