OPEN-SOURCE SCRIPT
FVG Profiles [TradingIQ]
Hello Traders!
🔹FVG Profiles [TradingIQ]
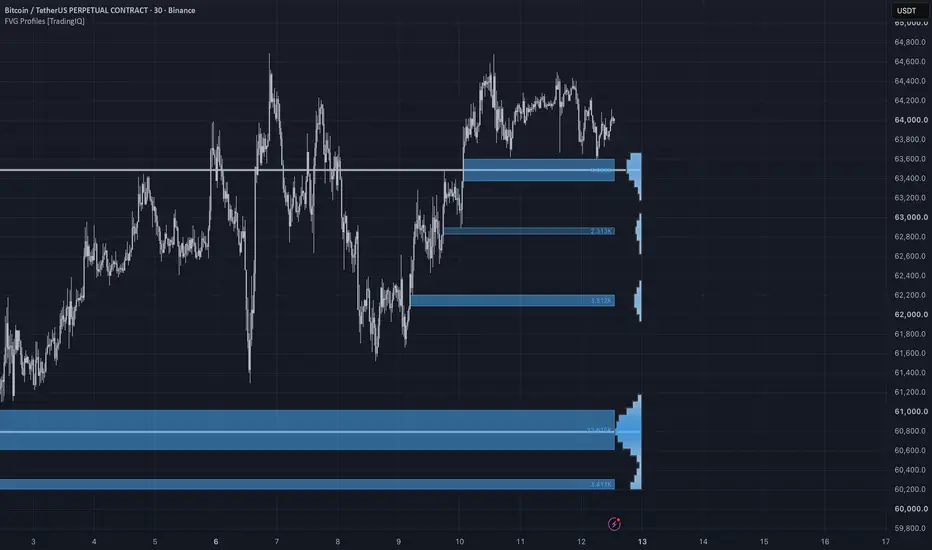
FVG Profiles is a fair value gap analysis tool designed to go beyond simply drawing FVG boxes on the chart.
Instead of treating every fair value gap the same, this indicator evaluates each FVG using:
It focuses on answering a deeper question:
Where are the most important active imbalance zones on the chart?
And more importantly:
Which gaps still have meaningful volume left behind them?
🔹What the indicator shows
🔸Bullish & Bearish Fair Value Gaps
The indicator detects both bullish and bearish fair value gaps directly on the chart.
A bullish FVG is detected when price leaves an upside imbalance.
A bearish FVG is detected when price leaves a downside imbalance.
These gaps are then tracked as active zones until they are mitigated, expired, or fully consumed by later price action.
This allows you to see:
🔸Time-of-Day Filtering
One of the most important parts of this indicator is that it does not only ask:
“Did a fair value gap form?”
It also asks:
“Was this fair value gap meaningful compared to what normally happens at this time of day?”
The script tracks rolling time-of-day statistics for both:
This helps compare the current FVG against historical activity from the same time of day.
The goal is to avoid treating normal market noise the same as statistically meaningful imbalance.
🔸Gap Strictness & Volume Strictness
The indicator includes strictness filters for both gap size and volume.
These filters use z-score style thresholds to determine whether a new FVG is significant enough to display.
Available strictness levels include:
Higher strictness means fewer gaps will qualify.
Lower strictness means more gaps will be shown.
This allows you to choose whether you want a broader view of market imbalance or only the most statistically significant FVGs.
🔸Remaining FVG Volume
Each detected FVG begins with an initial volume value.
As future candles trade back into the FVG zone, the script estimates how much of that gap volume has been consumed.
This allows each FVG to behave more like a living zone instead of a static box.
The indicator tracks:
As price overlaps the FVG, the remaining volume is reduced proportionally.
This helps show whether a gap is still meaningful or whether it has already been mostly consumed.
🔸FVG Box Visualization
Active fair value gaps are displayed directly on the chart.
The FVG boxes update as the gap is mitigated.
When volume remains inside the zone, the box continues to show the active imbalance area.
When the FVG is fully mitigated or expires, it is removed from the chart.
Optional volume text can also be displayed inside the FVG box.
This helps you quickly see:
🔸Master FVG Histogram
The Master Histogram is the main profile-style visualization.
Instead of only looking at individual FVGs, the indicator aggregates all active FVG zones into a single histogram.
This histogram shows where active bullish and bearish FVG volume is clustered across price.
It helps answer:
Where is active imbalance volume concentrated right now?
The histogram is drawn to the right of price and can be customized with:
🔸Bullish vs Bearish FVG Dominance
The Master Histogram separates bullish and bearish FVG volume.
Each price bin is colored based on whether bullish or bearish FVG volume is dominant at that level.
This allows you to quickly identify:
Instead of asking only:
“Where is the nearest fair value gap?”
you can ask:
“Where are active FVGs clustering across the chart?”
🔸KDE Smoothing
The histogram includes optional smoothing using an Epanechnikov Kernel Density Estimation model.
This helps reduce noisy, blocky histogram behavior and creates a smoother profile of active FVG concentration.
Higher bandwidth creates a smoother histogram.
Lower bandwidth keeps the histogram closer to the raw FVG volume distribution.
This is useful when you want the histogram to behave more like a profile instead of a fragmented set of isolated bins.
🔸Gap Zones / Local Maxima
The indicator can also detect local maxima inside the Master Histogram.
These are price areas where active FVG volume is locally concentrated compared to nearby bins.
When enabled, the indicator projects these levels left across the chart as Gap Zone lines.
This helps highlight:
The Gap Zone Percentile setting controls how selective these lines are.
A higher percentile shows fewer, more significant zones.
A lower percentile shows more potential gap zones.
🔹How to read it
Each FVG box represents an active imbalance.
The Master Histogram shows where active FVG volume is concentrated across all currently tracked gaps.
The Gap Zone lines highlight local peaks in the active FVG volume profile.
Together, these views help shift your thinking from:
“There is a fair value gap here.”
to:
“This is where active imbalance volume is still concentrated.”
🔹Example interpretations
🔹Why this indicator is useful
FVG Profiles gives you a structured way to analyze fair value gaps as dynamic volume zones.
It helps you see:
Instead of only drawing static FVG boxes, this tool attempts to quantify and profile the active imbalance still remaining in the market.
🔹Best use cases
🔹Inputs you can customize
🔹Important note
This script uses volume, gap size, and time-of-day statistics to evaluate fair value gaps.
This means:
This indicator is not a trading system by itself.
It is a framework for analyzing where active fair value gap volume remains and how those imbalances cluster across price.
Closing Notes
FVG Profiles is built to turn fair value gaps from static boxes into a more complete imbalance profile.
It helps you see not only where gaps formed, but where active FVG volume still remains.
As always, thank you TradingView!
🔹FVG Profiles [TradingIQ]
FVG Profiles is a fair value gap analysis tool designed to go beyond simply drawing FVG boxes on the chart.
Instead of treating every fair value gap the same, this indicator evaluates each FVG using:
- gap size
- volume behind the gap
- time-of-day context
- remaining unfilled volume
- active FVG clustering
- bullish vs bearish FVG dominance
- master histogram structure
- local maxima gap zones
It focuses on answering a deeper question:
Where are the most important active imbalance zones on the chart?
And more importantly:
Which gaps still have meaningful volume left behind them?
🔹What the indicator shows
🔸Bullish & Bearish Fair Value Gaps
The indicator detects both bullish and bearish fair value gaps directly on the chart.
A bullish FVG is detected when price leaves an upside imbalance.
A bearish FVG is detected when price leaves a downside imbalance.
These gaps are then tracked as active zones until they are mitigated, expired, or fully consumed by later price action.
This allows you to see:
- where bullish imbalances formed
- where bearish imbalances formed
- which FVGs are still active
- which FVGs have been partially filled
- which FVGs have been fully mitigated
🔸Time-of-Day Filtering
One of the most important parts of this indicator is that it does not only ask:
“Did a fair value gap form?”
It also asks:
“Was this fair value gap meaningful compared to what normally happens at this time of day?”
The script tracks rolling time-of-day statistics for both:
- volume
- gap height
This helps compare the current FVG against historical activity from the same time of day.
The goal is to avoid treating normal market noise the same as statistically meaningful imbalance.
🔸Gap Strictness & Volume Strictness
The indicator includes strictness filters for both gap size and volume.
These filters use z-score style thresholds to determine whether a new FVG is significant enough to display.
Available strictness levels include:
- None
- Low
- Medium
- High
- Extreme
Higher strictness means fewer gaps will qualify.
Lower strictness means more gaps will be shown.
This allows you to choose whether you want a broader view of market imbalance or only the most statistically significant FVGs.
🔸Remaining FVG Volume
Each detected FVG begins with an initial volume value.
As future candles trade back into the FVG zone, the script estimates how much of that gap volume has been consumed.
This allows each FVG to behave more like a living zone instead of a static box.
The indicator tracks:
- initial FVG volume
- remaining FVG volume
- partial mitigation
- full mitigation
- bullish remaining volume
- bearish remaining volume
As price overlaps the FVG, the remaining volume is reduced proportionally.
This helps show whether a gap is still meaningful or whether it has already been mostly consumed.
🔸FVG Box Visualization
Active fair value gaps are displayed directly on the chart.
The FVG boxes update as the gap is mitigated.
When volume remains inside the zone, the box continues to show the active imbalance area.
When the FVG is fully mitigated or expires, it is removed from the chart.
Optional volume text can also be displayed inside the FVG box.
This helps you quickly see:
- how much volume remains in the gap
- which gaps are still active
- which zones are being consumed
- where price is interacting with imbalance
🔸Master FVG Histogram
The Master Histogram is the main profile-style visualization.
Instead of only looking at individual FVGs, the indicator aggregates all active FVG zones into a single histogram.
This histogram shows where active bullish and bearish FVG volume is clustered across price.
It helps answer:
Where is active imbalance volume concentrated right now?
The histogram is drawn to the right of price and can be customized with:
- number of bins
- histogram offset
- maximum width
- KDE smoothing bandwidth
- transparency
- bullish colors
- bearish colors
🔸Bullish vs Bearish FVG Dominance
The Master Histogram separates bullish and bearish FVG volume.
Each price bin is colored based on whether bullish or bearish FVG volume is dominant at that level.
This allows you to quickly identify:
- bullish imbalance clusters
- bearish imbalance clusters
- zones where one side dominates
- areas where active FVG volume is concentrated
Instead of asking only:
“Where is the nearest fair value gap?”
you can ask:
“Where are active FVGs clustering across the chart?”
🔸KDE Smoothing
The histogram includes optional smoothing using an Epanechnikov Kernel Density Estimation model.
This helps reduce noisy, blocky histogram behavior and creates a smoother profile of active FVG concentration.
Higher bandwidth creates a smoother histogram.
Lower bandwidth keeps the histogram closer to the raw FVG volume distribution.
This is useful when you want the histogram to behave more like a profile instead of a fragmented set of isolated bins.
🔸Gap Zones / Local Maxima
The indicator can also detect local maxima inside the Master Histogram.
These are price areas where active FVG volume is locally concentrated compared to nearby bins.
When enabled, the indicator projects these levels left across the chart as Gap Zone lines.
This helps highlight:
- major active imbalance clusters
- high-concentration FVG zones
- potential reaction areas
- levels where multiple active gaps may overlap
The Gap Zone Percentile setting controls how selective these lines are.
A higher percentile shows fewer, more significant zones.
A lower percentile shows more potential gap zones.
🔹How to read it
Each FVG box represents an active imbalance.
The Master Histogram shows where active FVG volume is concentrated across all currently tracked gaps.
The Gap Zone lines highlight local peaks in the active FVG volume profile.
Together, these views help shift your thinking from:
“There is a fair value gap here.”
to:
“This is where active imbalance volume is still concentrated.”
🔹Example interpretations
- large bullish FVG + high remaining volume → active upside imbalance still present
- bearish FVG cluster above price → potential overhead imbalance zone
- histogram peak near current price → price is trading into concentrated active gap volume
- gap zone line aligns with structure → possible high-interest reaction area
- FVG box fading or disappearing → gap has been consumed, mitigated, or expired
- many active gaps clustered together → imbalance zone may be more important than a single isolated FVG
🔹Why this indicator is useful
FVG Profiles gives you a structured way to analyze fair value gaps as dynamic volume zones.
It helps you see:
- which FVGs are still active
- which gaps have meaningful volume behind them
- where FVG volume is clustering
- whether bullish or bearish imbalance dominates a zone
- how price is consuming active gaps over time
- where local maxima gap zones appear
Instead of only drawing static FVG boxes, this tool attempts to quantify and profile the active imbalance still remaining in the market.
🔹Best use cases
- tracking active fair value gaps
- finding clustered imbalance zones
- filtering out insignificant gaps
- studying FVG mitigation
- identifying potential reaction levels
- combining FVG analysis with market structure
- enhancing liquidity, imbalance, or price-action models
🔹Inputs you can customize
- Master Profile Bins
- Histogram Right Offset
- Histogram Max Width
- KDE Smoothing Bandwidth
- Max FVGs
- Max FVG Age
- Gap Strictness
- Volume Strictness
- Time-of-Day Memory Length
- Show FVG Boxes
- Show Master Histogram
- Show Gap Zones
- Gap Zone Percentile
- Show FVG Volume Text
- Master Alpha
- bullish and bearish histogram colors
- gap zone color
🔹Important note
This script uses volume, gap size, and time-of-day statistics to evaluate fair value gaps.
This means:
- FVG significance depends on the selected strictness settings
- time-of-day averages depend on the available chart history
- volume behavior can vary between symbols and sessions
- the Master Histogram only represents currently active tracked FVGs
- gap zones are analytical reference levels, not predictive signals
This indicator is not a trading system by itself.
It is a framework for analyzing where active fair value gap volume remains and how those imbalances cluster across price.
Closing Notes
FVG Profiles is built to turn fair value gaps from static boxes into a more complete imbalance profile.
It helps you see not only where gaps formed, but where active FVG volume still remains.
As always, thank you TradingView!
오픈 소스 스크립트
트레이딩뷰의 진정한 정신에 따라, 이 스크립트의 작성자는 이를 오픈소스로 공개하여 트레이더들이 기능을 검토하고 검증할 수 있도록 했습니다. 작성자에게 찬사를 보냅니다! 이 코드는 무료로 사용할 수 있지만, 코드를 재게시하는 경우 하우스 룰이 적용된다는 점을 기억하세요.

Get Access To Our Tools: tradingiq.io
Subscribe For Daily Content: youtube.com/watch?v=Gx_cW29BUds
Subscribe For Daily Content: youtube.com/watch?v=Gx_cW29BUds
면책사항
해당 정보와 게시물은 금융, 투자, 트레이딩 또는 기타 유형의 조언이나 권장 사항으로 간주되지 않으며, 트레이딩뷰에서 제공하거나 보증하는 것이 아닙니다. 자세한 내용은 이용 약관을 참조하세요.
오픈 소스 스크립트
트레이딩뷰의 진정한 정신에 따라, 이 스크립트의 작성자는 이를 오픈소스로 공개하여 트레이더들이 기능을 검토하고 검증할 수 있도록 했습니다. 작성자에게 찬사를 보냅니다! 이 코드는 무료로 사용할 수 있지만, 코드를 재게시하는 경우 하우스 룰이 적용된다는 점을 기억하세요.
Get Access To Our Tools: tradingiq.io
Subscribe For Daily Content: youtube.com/watch?v=Gx_cW29BUds
Subscribe For Daily Content: youtube.com/watch?v=Gx_cW29BUds
면책사항
해당 정보와 게시물은 금융, 투자, 트레이딩 또는 기타 유형의 조언이나 권장 사항으로 간주되지 않으며, 트레이딩뷰에서 제공하거나 보증하는 것이 아닙니다. 자세한 내용은 이용 약관을 참조하세요.