OPEN-SOURCE SCRIPT
ICT Swing Structure [STL/STH/ ITL/ITH /LTL/LTH]
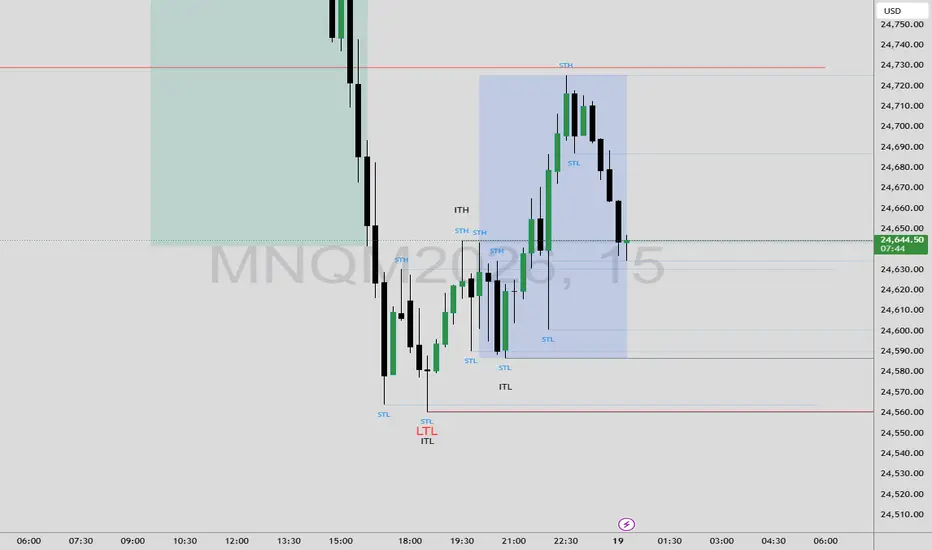
ICT Swing Structure [STL/STH · ITL/ITH · LTL/LTH]
This indicator automatically identifies and labels the three degrees of market structure as taught in the ICT (Inner Circle Trader) 2022 Mentorship — Short-Term, Intermediate-Term, and Long-Term swing highs and lows.
Price swings are classified into a nested hierarchy:
STH / STL — Short-Term Highs and Lows, the most frequent pivots on any timeframe
ITH / ITL — Intermediate-Term Highs and Lows, formed when a short-term swing is confirmed by surrounding short-term pivots on both sides
LTH / LTL — Long-Term Highs and Lows, the most significant turning points requiring intermediate-term confirmation on both sides
Each degree is displayed with a distinct color-coded label and a horizontal reference line extending forward from the swing point. Line lengths are scaled to significance — ST levels extend the shortest distance, LT levels the longest — keeping the chart clean while highlighting what matters most.
Fully customizable with toggles for each degree, adjustable pivot sensitivity, and individual color controls for ST, IT, and LT levels.
Best used as part of a top-down analysis workflow to define HTF bias, identify liquidity pools, and frame precision entries across all asset classes and timeframes.
This indicator automatically identifies and labels the three degrees of market structure as taught in the ICT (Inner Circle Trader) 2022 Mentorship — Short-Term, Intermediate-Term, and Long-Term swing highs and lows.
Price swings are classified into a nested hierarchy:
STH / STL — Short-Term Highs and Lows, the most frequent pivots on any timeframe
ITH / ITL — Intermediate-Term Highs and Lows, formed when a short-term swing is confirmed by surrounding short-term pivots on both sides
LTH / LTL — Long-Term Highs and Lows, the most significant turning points requiring intermediate-term confirmation on both sides
Each degree is displayed with a distinct color-coded label and a horizontal reference line extending forward from the swing point. Line lengths are scaled to significance — ST levels extend the shortest distance, LT levels the longest — keeping the chart clean while highlighting what matters most.
Fully customizable with toggles for each degree, adjustable pivot sensitivity, and individual color controls for ST, IT, and LT levels.
Best used as part of a top-down analysis workflow to define HTF bias, identify liquidity pools, and frame precision entries across all asset classes and timeframes.
오픈 소스 스크립트
트레이딩뷰의 진정한 정신에 따라, 이 스크립트의 작성자는 이를 오픈소스로 공개하여 트레이더들이 기능을 검토하고 검증할 수 있도록 했습니다. 작성자에게 찬사를 보냅니다! 이 코드는 무료로 사용할 수 있지만, 코드를 재게시하는 경우 하우스 룰이 적용된다는 점을 기억하세요.

면책사항
해당 정보와 게시물은 금융, 투자, 트레이딩 또는 기타 유형의 조언이나 권장 사항으로 간주되지 않으며, 트레이딩뷰에서 제공하거나 보증하는 것이 아닙니다. 자세한 내용은 이용 약관을 참조하세요.
오픈 소스 스크립트
트레이딩뷰의 진정한 정신에 따라, 이 스크립트의 작성자는 이를 오픈소스로 공개하여 트레이더들이 기능을 검토하고 검증할 수 있도록 했습니다. 작성자에게 찬사를 보냅니다! 이 코드는 무료로 사용할 수 있지만, 코드를 재게시하는 경우 하우스 룰이 적용된다는 점을 기억하세요.
면책사항
해당 정보와 게시물은 금융, 투자, 트레이딩 또는 기타 유형의 조언이나 권장 사항으로 간주되지 않으며, 트레이딩뷰에서 제공하거나 보증하는 것이 아닙니다. 자세한 내용은 이용 약관을 참조하세요.