Relative Strength Line v1.3
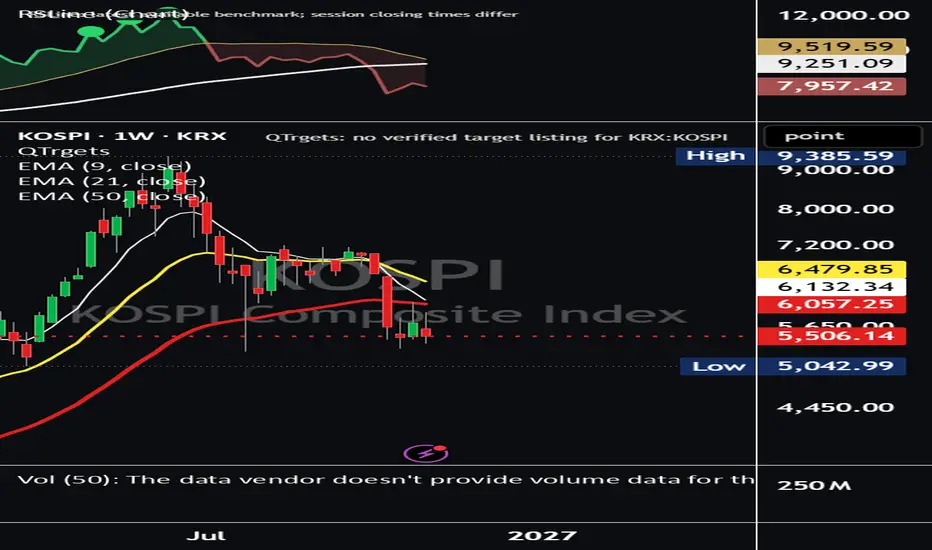
RSLine measures a stock’s performance relative to a chosen benchmark, with QQQ as the default. A rising line indicates outperformance; a falling line indicates underperformance.
Includes adjustable moving averages, green/red trend shading and new-high markers:
- **Green:** RS and price both exceed their previous lookback highs.
- **Purple:** RS exceeds its previous high while price has yet to exceed its own.
Calculate Daily, Weekly or Monthly RS independently of your chart timeframe. An optional table displays relative returns across multiple periods. Dots confirm after both the selected RS period and chart candle close.
Designed for standard Daily, Weekly and Monthly charts.
Includes adjustable moving averages, green/red trend shading and new-high markers:
- **Green:** RS and price both exceed their previous lookback highs.
- **Purple:** RS exceeds its previous high while price has yet to exceed its own.
Calculate Daily, Weekly or Monthly RS independently of your chart timeframe. An optional table displays relative returns across multiple periods. Dots confirm after both the selected RS period and chart candle close.
Designed for standard Daily, Weekly and Monthly charts.

@StocksMathPoker on X
1amInvesting.com
1amInvesting.com
면책사항
해당 정보와 게시물은 금융, 투자, 트레이딩 또는 기타 유형의 조언이나 권장 사항으로 간주되지 않으며, 트레이딩뷰에서 제공하거나 보증하는 것이 아닙니다. 자세한 내용은 이용 약관을 참조하세요.
@StocksMathPoker on X
1amInvesting.com
1amInvesting.com
면책사항
해당 정보와 게시물은 금융, 투자, 트레이딩 또는 기타 유형의 조언이나 권장 사항으로 간주되지 않으며, 트레이딩뷰에서 제공하거나 보증하는 것이 아닙니다. 자세한 내용은 이용 약관을 참조하세요.