OPEN-SOURCE SCRIPT
업데이트됨 Close Momentum (Area)
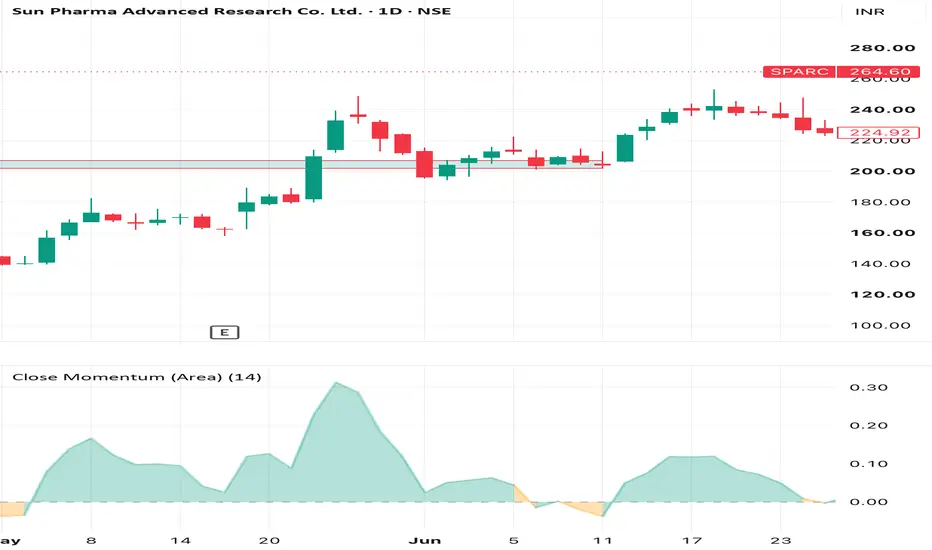
This indicator measures how today’s closing price compares to its own average over a user-defined lookback period (default: ~6 months). It helps you quickly see whether price is trading above or below its medium-term average in a single, easy-to-read pane.
Formula:
Momentum = Close ÷ Average Close (over N days)
• Momentum > 1 → Price is above its N-day average (bullish relative to medium-term mean).
• Momentum = 1 → Price equals its N-day average.
• Momentum < 1 → Price is below its N-day average (bearish relative to medium-term mean).
The result is plotted as a filled area anchored at the 1.0 line, making it easy tospot regimes where price is persistently strong (>1) or weak (<1).
Settings:
• Lookback days for average close – Number of bars used to calculate the average close.
• Default: 126 (≈ 6 months, assuming ~21 trading days/month).
• Adjust for shorter/longer horizons (e.g., 63 for ~3 months, 252 for ~1 year).
How traders can use it:
• Identify trend bias: sustained readings above 1 suggest an uptrend relative to the chosen period; below 1 suggests a downtrend.
• Spot mean-reversion setups: extremes far from 1 may indicate overextended moves.
• Combine with price action or other indicators to filter entries and confirm momentum shifts.
This is a simple, visual way to track medium-term price momentum without cluttering your main chart.
Formula:
Momentum = Close ÷ Average Close (over N days)
• Momentum > 1 → Price is above its N-day average (bullish relative to medium-term mean).
• Momentum = 1 → Price equals its N-day average.
• Momentum < 1 → Price is below its N-day average (bearish relative to medium-term mean).
The result is plotted as a filled area anchored at the 1.0 line, making it easy tospot regimes where price is persistently strong (>1) or weak (<1).
Settings:
• Lookback days for average close – Number of bars used to calculate the average close.
• Default: 126 (≈ 6 months, assuming ~21 trading days/month).
• Adjust for shorter/longer horizons (e.g., 63 for ~3 months, 252 for ~1 year).
How traders can use it:
• Identify trend bias: sustained readings above 1 suggest an uptrend relative to the chosen period; below 1 suggests a downtrend.
• Spot mean-reversion setups: extremes far from 1 may indicate overextended moves.
• Combine with price action or other indicators to filter entries and confirm momentum shifts.
This is a simple, visual way to track medium-term price momentum without cluttering your main chart.
릴리즈 노트
• momentum itself is centered around 1.0, so plotting it with area style makes TradingView fill the space between 1 and the value.• By plotting delta = momentum - 1.0 , the baseline becomes 0, so the filled area is centered properly and no longer occupies the full band from 1 to 0.
릴리즈 노트
changed the name오픈 소스 스크립트
트레이딩뷰의 진정한 정신에 따라, 이 스크립트의 작성자는 이를 오픈소스로 공개하여 트레이더들이 기능을 검토하고 검증할 수 있도록 했습니다. 작성자에게 찬사를 보냅니다! 이 코드는 무료로 사용할 수 있지만, 코드를 재게시하는 경우 하우스 룰이 적용된다는 점을 기억하세요.

면책사항
해당 정보와 게시물은 금융, 투자, 트레이딩 또는 기타 유형의 조언이나 권장 사항으로 간주되지 않으며, 트레이딩뷰에서 제공하거나 보증하는 것이 아닙니다. 자세한 내용은 이용 약관을 참조하세요.
오픈 소스 스크립트
트레이딩뷰의 진정한 정신에 따라, 이 스크립트의 작성자는 이를 오픈소스로 공개하여 트레이더들이 기능을 검토하고 검증할 수 있도록 했습니다. 작성자에게 찬사를 보냅니다! 이 코드는 무료로 사용할 수 있지만, 코드를 재게시하는 경우 하우스 룰이 적용된다는 점을 기억하세요.
면책사항
해당 정보와 게시물은 금융, 투자, 트레이딩 또는 기타 유형의 조언이나 권장 사항으로 간주되지 않으며, 트레이딩뷰에서 제공하거나 보증하는 것이 아닙니다. 자세한 내용은 이용 약관을 참조하세요.