Pattern Structure Pro
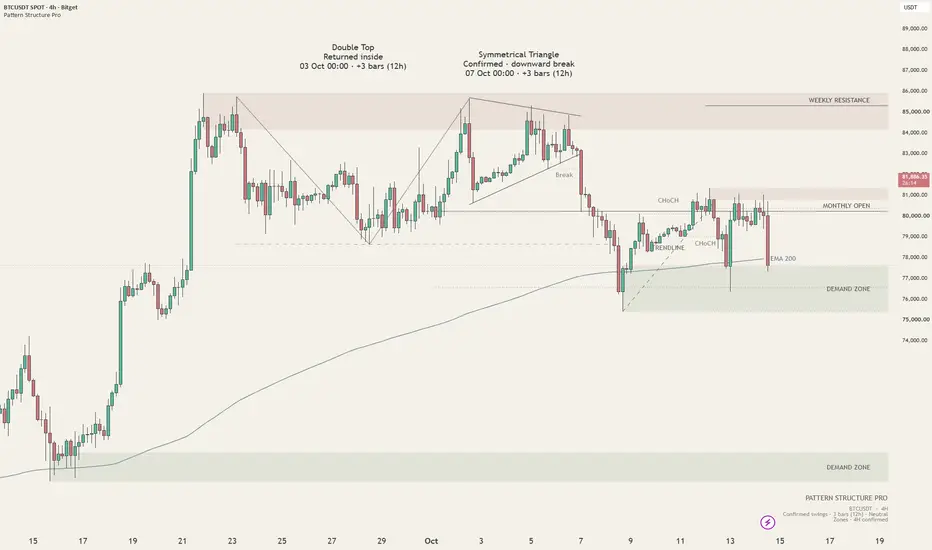
Pattern Structure Pro is an open-source chart overlay for patterns, market structure and price context.
It displays tops/bottoms, head-and-shoulders formations, triangles, wedges, flags, pennants, channels and rectangles. Additional layers include swing labels, BOS/CHoCH, a swing trendline, supply/demand zones, weekly/monthly reference levels and optional EMA 200. Up to three selected patterns are shown.
The engine compares pivot sequences and fitted boundaries using ATR-based tolerances. Pattern captions describe forming structures, boundary breaks or a return inside. Historical geometry appears after the required pivots have been detected. Recognition can miss formations or produce false positives.
Intended intervals: 1H, 2H, 4H and 1D. Patterns, structure and EMA use the chart interval. Zones use a shared 4H source by default; choose Chart for interval-specific zones.
Analysis is the default view, showing geometry, states and timing. Stories uses compact annotations and fewer context layers. All major layers can be toggled in settings.
Released under the MIT License. Everyone is welcome to inspect the source, suggest improvements and contribute. This is a chart-analysis tool, not a trade recommendation.
It displays tops/bottoms, head-and-shoulders formations, triangles, wedges, flags, pennants, channels and rectangles. Additional layers include swing labels, BOS/CHoCH, a swing trendline, supply/demand zones, weekly/monthly reference levels and optional EMA 200. Up to three selected patterns are shown.
The engine compares pivot sequences and fitted boundaries using ATR-based tolerances. Pattern captions describe forming structures, boundary breaks or a return inside. Historical geometry appears after the required pivots have been detected. Recognition can miss formations or produce false positives.
Intended intervals: 1H, 2H, 4H and 1D. Patterns, structure and EMA use the chart interval. Zones use a shared 4H source by default; choose Chart for interval-specific zones.
Analysis is the default view, showing geometry, states and timing. Stories uses compact annotations and fewer context layers. All major layers can be toggled in settings.
Released under the MIT License. Everyone is welcome to inspect the source, suggest improvements and contribute. This is a chart-analysis tool, not a trade recommendation.

면책사항
해당 정보와 게시물은 금융, 투자, 트레이딩 또는 기타 유형의 조언이나 권장 사항으로 간주되지 않으며, 트레이딩뷰에서 제공하거나 보증하는 것이 아닙니다. 자세한 내용은 이용 약관을 참조하세요.
면책사항
해당 정보와 게시물은 금융, 투자, 트레이딩 또는 기타 유형의 조언이나 권장 사항으로 간주되지 않으며, 트레이딩뷰에서 제공하거나 보증하는 것이 아닙니다. 자세한 내용은 이용 약관을 참조하세요.