업데이트됨
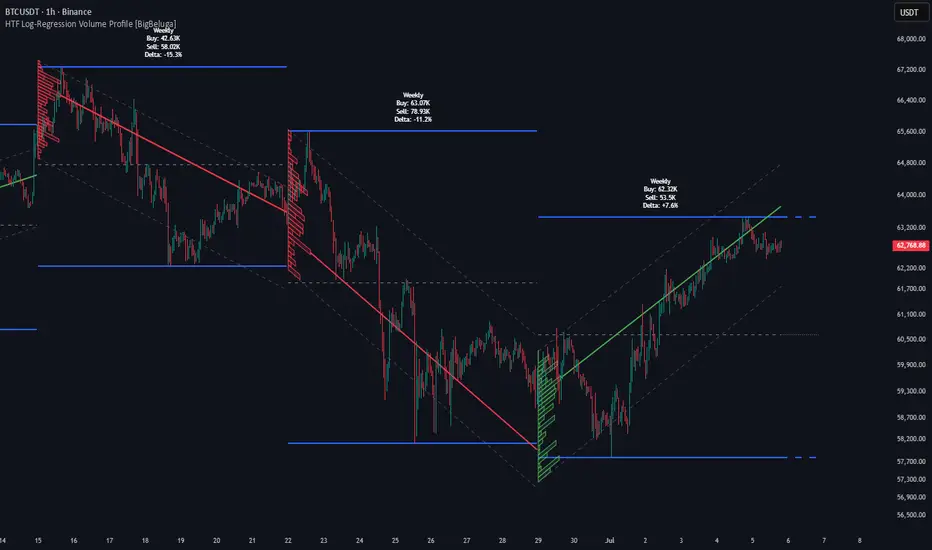
HTF Log-Regression Volume Profile [BigBeluga]
More exclusive indicators from BigBeluga
Subscribe to BigBeluga Premium for $66.47/month to get exclusive indicators by this author. You pay right on TradingView and can use them on your charts straight away.
Explore BigBeluga Premium🔵 OVERVIEW
🔵 FEATURES
🔵 HOW TO USE
🔵 NOTES
The HTF Log-Regression Volume Profile is an advanced technical indicator created by BigBeluga to map higher-timeframe logarithmic regression channels combined with an integrated volume profile distribution. Traditional volume profiles are often fixed to standard horizontal ranges or static session boxes that fail to capture curving price trends and logarithmic growth dynamics. In order to provide a solution to this problem, this indicator calculates adaptive higher-timeframe sessions using logarithmic regression curves and standard deviation boundaries, plotting internal volume histogram bins and Point of Control (POC) lines directly onto the chart.
The indicator aims to visualize institutional volume distribution, equilibrium pricing, and structural value areas across multi-bar sessions. The core element of its calculation involves evaluating logarithmic regression slope and intercept metrics alongside session standard deviations defined as:Pine Script® Pine Script®
where slope and intercept establish the curving regression baseline, and deviation dictates the channel width for the volume profile bounds. Higher values of bin counts and channel width multipliers allow the indicator to filter out minor market noise and isolate major high-volume structural nodes.
🔵 FEATURES
The system utilizes a multi-layered matrix structure to provide actionable market intelligence:
1 — Higher-Timeframe Adaptive Engine
- Auto HTF Resolution: Automatically adapts higher-timeframe sessions based on the chart's current resolution or allows manual session customization.
- Session Tracking & History: Maintains active session boundaries while archiving historical finished sessions up to a user-defined limit.
2 — Logarithmic Regression Channels & Projections
- Regression Bounds: Plots session high, low, and equilibrium midlines curved along a logarithmic regression formula via
.Pine Script® - Level Extensions: Projects session boundaries and midlines forward into future bars using configurable extension limits.
3 — Integrated Volume Profile & POC Tracking
- Horizontal Volume Bins: Projects dynamic volume profile histograms inside the regression channel using custom polylines and color-coded delta metrics.
- Point of Control (POC): Highlights the highest-volume price node within the active session via a dedicated POC line and provides an interactive statistics dashboard box.
🔵 HOW TO USE
Apart from the basic visualization of regression channels, this tool can also act in alternative ways to support decision-making:
- Identify Value Areas via Volume Profile: Observe the horizontal volume bins and the Point of Control (POC) line to spot where the heaviest volume concentration occurred during the higher-timeframe session.
- Trade Channel Rejections: Use the upper and lower logarithmic regression boundaries and their forward extensions as dynamic support and resistance zones.
- Monitor Buying and Selling Pressure: Check the integrated statistics label displaying buy volume, sell volume, and net delta percentage to gauge order flow dominance within the active session.
🔵 NOTES
Why this implementation is unique:
- It merges logarithmic regression channels with an internal volume profile distribution across higher-timeframe sessions.
- The dynamic polyline volume profile engine automatically adapts bin widths to curving regression slopes.
- The script is fully optimized for Pine Script version 6, utilizing advanced user-defined types, custom arrays, and polyline rendering for maximum performance.
릴리즈 노트
- Added style for upper and lower logarithmic regression channel lines릴리즈 노트
Update:if chart on monthly indicator switch HTF to the 12 Month / 1 year
릴리즈 노트
- Minor Bug Fix릴리즈 노트
Fixed stats label text color withnow it changes to black when chart color is white and to white when chart bg color is black

🌐 bigbeluga.org/tv - Get access to our powerful tools & indicators.
🔵 Learn More -> docs.bigbeluga.org/
🔵 Join Discord -> go.bigbeluga.org/k65q9bfqfu
All content provided by BigBeluga is for educational purposes only
🔵 Learn More -> docs.bigbeluga.org/
🔵 Join Discord -> go.bigbeluga.org/k65q9bfqfu
All content provided by BigBeluga is for educational purposes only
면책사항
해당 정보와 게시물은 금융, 투자, 트레이딩 또는 기타 유형의 조언이나 권장 사항으로 간주되지 않으며, 트레이딩뷰에서 제공하거나 보증하는 것이 아닙니다. 자세한 내용은 이용 약관을 참조하세요.
🌐 bigbeluga.org/tv - Get access to our powerful tools & indicators.
🔵 Learn More -> docs.bigbeluga.org/
🔵 Join Discord -> go.bigbeluga.org/k65q9bfqfu
All content provided by BigBeluga is for educational purposes only
🔵 Learn More -> docs.bigbeluga.org/
🔵 Join Discord -> go.bigbeluga.org/k65q9bfqfu
All content provided by BigBeluga is for educational purposes only
면책사항
해당 정보와 게시물은 금융, 투자, 트레이딩 또는 기타 유형의 조언이나 권장 사항으로 간주되지 않으며, 트레이딩뷰에서 제공하거나 보증하는 것이 아닙니다. 자세한 내용은 이용 약관을 참조하세요.