업데이트됨
Candle Emotion Oscillator [CEO]
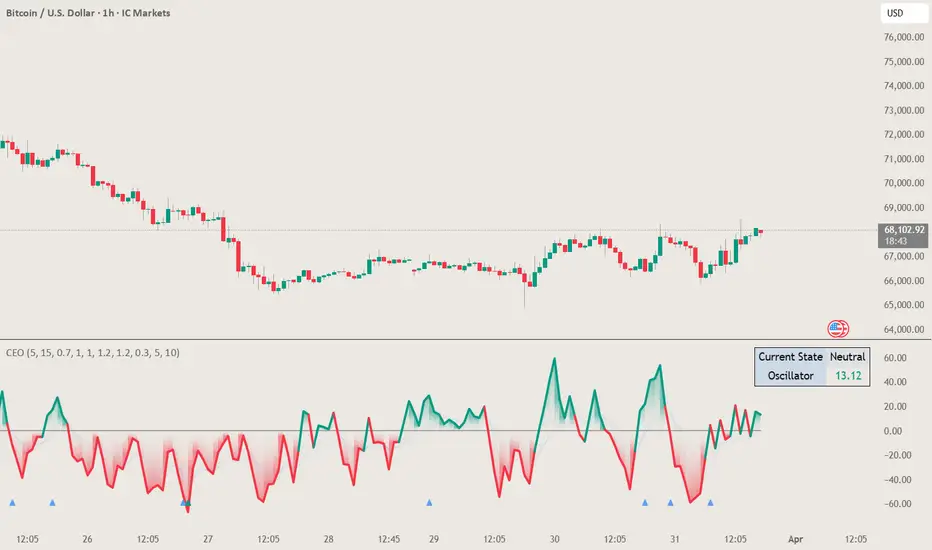
Candle Emotion Oscillator (CEO) - Revolutionary User Guide
🧠 World's First Market Psychology Oscillator
The Candle Emotion Oscillator (CEO) is a groundbreaking indicator that measures market emotions through pure candle price action analysis. This is the first oscillator ever created that translates candle patterns into psychological states, giving you unprecedented insight into market sentiment.
🚀 Revolutionary Concept
What Makes CEO Unique
The Four Core Emotions
🟢 GREED (Positive Values)
What it measures: Market conviction and decisiveness
🔴 FEAR (Negative Values)
What it measures: Market uncertainty and indecision
🚀 EUPHORIA (Extreme Positive)
What it measures: Excessive optimism and buying pressure
Trading Implication: Overbought, reversal warning
💥 PANIC (Extreme Negative)
What it measures: Capitulation and selling pressure
Oscillator: Values below -60
Trading Implication: Oversold, reversal opportunity
📊 Visual Elements Explained
Main Components
Thin Blue Line: Emotion trend (longer-term context)
Background Gradient: Emotional intensity
Darker = stronger emotions
Lighter = weaker emotions
Diamond Signals: 🔶 Emotional exhaustion detected
Rocket Signals: 🚀 Extreme euphoria warning
Explosion Signals: 💥 Extreme panic warning
Information Table (Top Right)
🧠 World's First Market Psychology Oscillator
The Candle Emotion Oscillator (CEO) is a groundbreaking indicator that measures market emotions through pure candle price action analysis. This is the first oscillator ever created that translates candle patterns into psychological states, giving you unprecedented insight into market sentiment.
🚀 Revolutionary Concept
What Makes CEO Unique
- 100% Pure Price Action: No volume, no external data - just candle analysis
- Market Psychology: Measures actual emotions: Fear, Greed, Panic, Euphoria
- Never Been Done Before: First oscillator to analyze market emotions
- Exhaustion Prediction: Detects emotional fatigue before reversals
- Fast Response: Perfect for your 2-5 minute scalping setup
The Four Core Emotions
🟢 GREED (Positive Values)
What it measures: Market conviction and decisiveness
- Candle Pattern: Large bodies, small wicks
- Psychology: Traders are confident and decisive
- Oscillator: Positive values (0 to +100)
- Trading Implication: Trend continuation likely
🔴 FEAR (Negative Values)
What it measures: Market uncertainty and indecision
- Candle Pattern: Small bodies, large wicks
- Psychology: Traders are uncertain and hesitant
- Oscillator: Negative values (0 to -100)
- Trading Implication: Consolidation or reversal likely
🚀 EUPHORIA (Extreme Positive)
What it measures: Excessive optimism and buying pressure
- Candle Pattern: Large green bodies with upper wicks
- Psychology: Extreme bullish sentiment
- Oscillator: Values above +60
Trading Implication: Overbought, reversal warning
💥 PANIC (Extreme Negative)
What it measures: Capitulation and selling pressure
- Candle Pattern: Large red bodies with lower wicks
- Psychology: Extreme bearish sentiment
Oscillator: Values below -60
Trading Implication: Oversold, reversal opportunity
📊 Visual Elements Explained
Main Components
- Thick Colored Line: Primary emotion oscillator
- Green: Greed (positive emotions)
- Red: Fear (negative emotions)
- Bright Green: Euphoria (extreme positive)
- Dark Red: Panic (extreme negative)
Thin Blue Line: Emotion trend (longer-term context)
Background Gradient: Emotional intensity
Darker = stronger emotions
Lighter = weaker emotions
Diamond Signals: 🔶 Emotional exhaustion detected
Rocket Signals: 🚀 Extreme euphoria warning
Explosion Signals: 💥 Extreme panic warning
Information Table (Top Right)
릴리즈 노트
**Key Enhancements Made:****Main Oscillator Styling:**
Replaced the previous column-based plot with a thick, bold line (`linewidth=3`) that dynamically changes color based on the market's emotional state — green for bullish emotion and red for bearish emotion.
**Vertical Gradient Fill:**
Added a smooth vertical gradient that flows from the equilibrium (zero) line to the oscillator value. It uses a fading transparency effect to create a clean "glow" appearance.
**Ribbon Background:**
Integrated five faint background EMAs of the oscillator to create a subtle "ribbon" effect. This provides better context for trend momentum and depth without adding clutter.
**Status Information:**
Added a real-time status table in the top-right corner that displays the current dominant emotion (e.g., Euphoria, Greed, Panic, Fear) along with the exact oscillator value.
**Refined Signals:**
Updated the exhaustion and extreme emotion signals to be more subtle and less obtrusive, keeping the overall chart clean and professional.
Key Enhancements Made:
Main Oscillator Styling:
Replaced the previous column-based plot with a thick, bold line (linewidth=3) that dynamically changes color based on the market's emotional state — green for bullish emotion and red for bearish emotion.
Vertical Gradient Fill:
Added a smooth vertical gradient that flows from the equilibrium (zero) line to the oscillator value. It uses a fading transparency effect to create a clean "glow" appearance.
Ribbon Background:
Integrated five faint background EMAs of the oscillator to create a subtle "ribbon" effect. This provides better context for trend momentum and depth without adding clutter.
Status Information:
Added a real-time status table in the top-right corner that displays the current dominant emotion (e.g., Euphoria, Greed, Panic, Fear) along with the exact oscillator value.
Refined Signals:
Updated the exhaustion and extreme emotion signals to be more subtle and less obtrusive, keeping the overall chart clean and professional.
릴리즈 노트
updated name
면책사항
해당 정보와 게시물은 금융, 투자, 트레이딩 또는 기타 유형의 조언이나 권장 사항으로 간주되지 않으며, 트레이딩뷰에서 제공하거나 보증하는 것이 아닙니다. 자세한 내용은 이용 약관을 참조하세요.
면책사항
해당 정보와 게시물은 금융, 투자, 트레이딩 또는 기타 유형의 조언이나 권장 사항으로 간주되지 않으며, 트레이딩뷰에서 제공하거나 보증하는 것이 아닙니다. 자세한 내용은 이용 약관을 참조하세요.